
Your accounts can show a profit even when your overdraft has increased. Both can be right, because farm profit vs cash flow is a comparison between two measures that answer two different questions, and the gap between them can be explained one line at a time.
It is worth explaining, because the gap comes in two kinds. Some of it is timing, and it comes back when the grain is sold and the pools pay out. Some of it is permanent, and it will be there again next year. Knowing which kind you have tells you whether to wait for the grain cheque or go and talk to the bank.
Quick Answer
Farm profit is what the season earned, with depreciation charged and unsold grain valued. Cash flow is what went through the bank. A profitable farm runs short of cash when profit is tied up in grain in the silo or a pool, prepaid inputs and Farm Management Deposits (FMD), or has been spent on loan principal, machinery, drawings and income tax.
The gap has two parts:
- Timing, which comes back: unsold grain, pool payments to come, prepaid inputs, GST refunds and FMD deposits.
- Cash that is not a cost in a Profit and Loss: loan principal, machinery purchases, drawings and income tax.
The worked example below walks $180,000 of management profit, line by line, to a bank balance that finished the year $40,000 lower, and shows that $150,000 of the gap comes back.
This season the gap is likely to be wider than usual in the south. ABARES’ September 2026 Australian Crop Report forecasts the winter crop at 61 million tonnes, which would be the fourth largest on record, with excellent growing conditions in South Australia, Victoria and southern New South Wales.
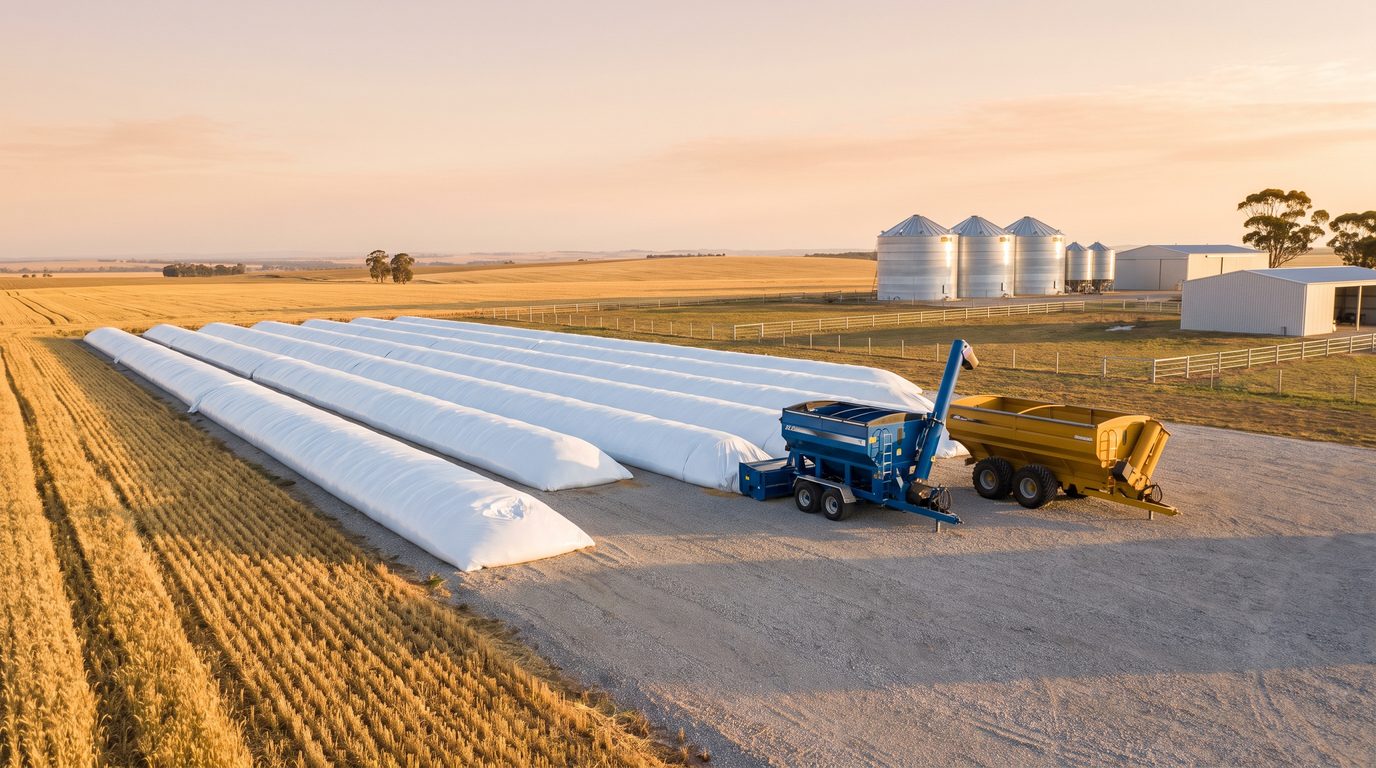
A lot of that grain will sit in silos, bags, warehouses and pools well into next year. A hardstand lined with full grain bags is a fine sight after a season like this. Every tonne in them counts toward the season’s profit, and none of it is in the bank yet.
Farm profit vs cash flow: what each one measures
In Farming the Business, the GRDC manual I wrote in 2015, I set out three financial measures and the question each one answers. None of them substitutes for another.
Three measures, three questions
- Cash flow measures liquidity
- Can the business pay its bills, interest and loan repayments when they fall due? Measured with a cash flow budget, month by month.
- Profit measures efficiency
- Once every cost of the season’s production is counted, including the costs that never touch the bank, did the business make money on the capital it used? Measured with a profit and loss budget.
- Net worth measures wealth
- Is the business worth more than it was a year ago? Measured with a balance sheet.
Liquidity plus efficiency plus wealth is how the manual defines sound business practice. A farm can be strong on one and weak on another in the same year.
Profit is built on an accrual year, which for a grain grower is usually a production year from about March to the following February. As the manual puts it, “all that is produced in the season is valued, regardless of when the income is received, and all the costs of production for that season are used regardless of when they are paid.”
So grain delivered to a pool counts in full in the year of delivery, even though the final payment can be up to 18 months away. Profit also counts what the bank statement never shows: depreciation on machinery that will one day need replacing, and the value of grain and livestock produced but not yet sold.
Cash flow counts money on the day it moves, and nothing else. It ignores depreciation, because no money leaves, and unsold grain, because no money has arrived. But it includes things a profit and loss leaves out altogether: loan principal, machinery bought with cash, the family’s drawings, income tax and money moved into a Farm Management Deposit. None of those are costs of running the farm. All of them empty the account.
The manual’s sample farm shows both at once
The section of the manual I wrote with Associate Professor Bill Malcolm of the University of Melbourne uses a 2,000 hectare mixed sample farm. Two of its tables make the whole point.
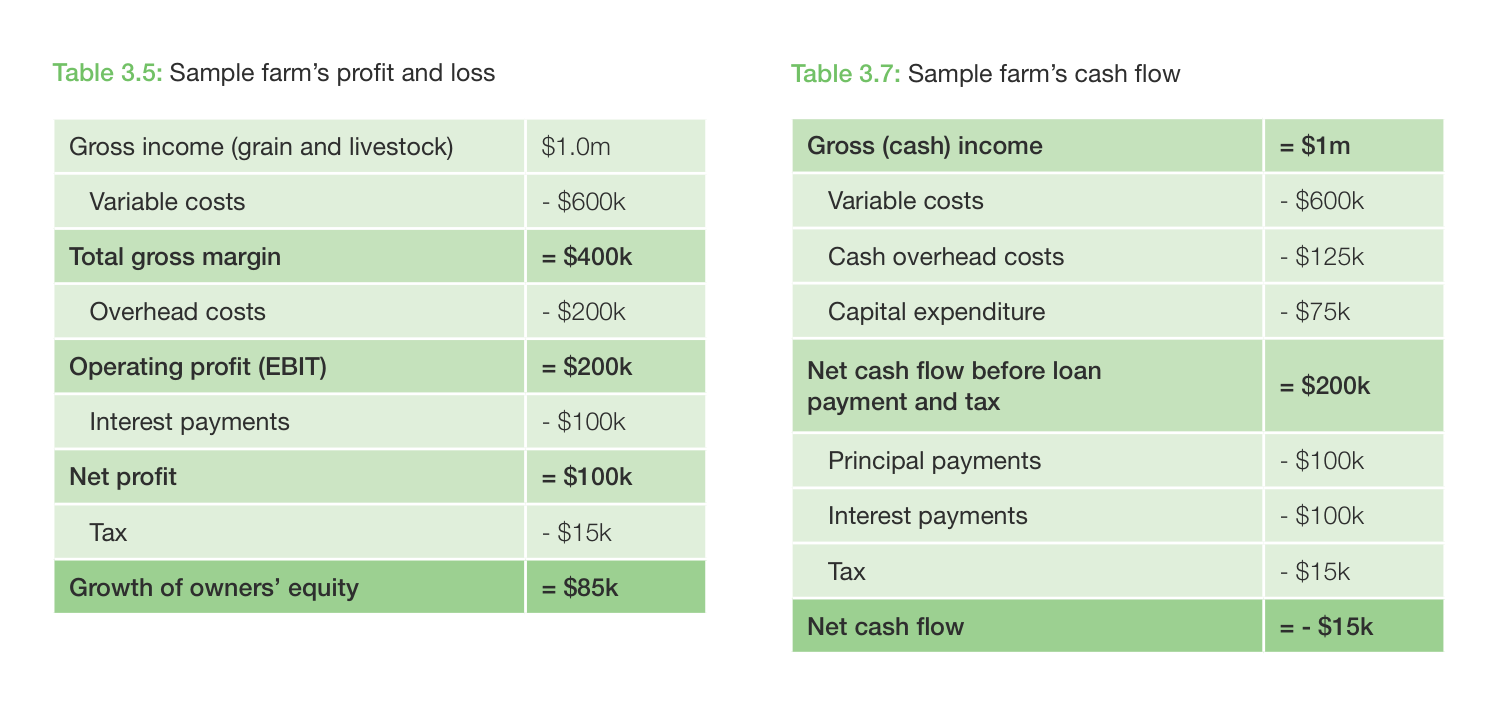
The walk between those two numbers has three lines. Add back $75,000 of depreciation, which sits in the $200,000 of overheads but cost nothing in cash. Take off the $75,000 of equipment bought with cash. Take off the $100,000 of loan principal. $85,000 plus $75,000, less $75,000, less $100,000, is minus $15,000.
The manual’s verdict on that farm is worth knowing by heart: “The profit can be sound but the cash position unsound, and vice versa.”
ABARES reports the same split
ABARES’ September 2026 Agricultural Commodities Report forecasts the average broadacre farm’s farm cash income at $355,000 for 2026-27 and its farm business profit at $133,000, the profit figure down 39 per cent from $219,000 in 2025-26. Both are in 2025-26 dollars.
Farm cash income is total cash receipts less total cash costs, and those costs are payments for materials, services, hired labour, rent and interest. Farm business profit starts there, adds the build-up in trading stocks such as grain, wool and livestock on hand, and takes off depreciation and the imputed value of the owner’s and family’s labour.
On average the cash number is $222,000 bigger, but that is not money to spare. Capital and household spending are left out of cash costs, and loan principal and income tax are not among them either, so all of them still have to come out of farm cash income.
Why a profitable farm runs short of cash: the walk, line by line
The reconciliation between profit and the change in the bank balance is often called a walk. Start from profit and adjust for everything that moved one without moving the other. Every line falls into one of three groups: costs that never touch the bank, timing, and cash that leaves without being a cost.
Start from the right profit
The walk here starts from management profit: net profit before tax on a production year. That is not the profit in your tax return, which runs July to June and so, for most dryland grain growers, lines up one season’s income against the next season’s costs. The tax return also uses tax depreciation, and it does not deduct family drawings at all, because they are not a tax deduction.
None of this is a criticism of your accountant. The tax return is built for a different job, and minimising tax is not the same question as whether the farm made money. I talk that through in our podcast episode on what motivates your accountant.
In place of drawings, the manual’s management profit and loss charges a managerial allowance: what it would cost to hire someone to run the place. In its Upndowns Farm example the family draws $87,000, the profit and loss is charged $120,000, and the $33,000 difference is treated as the family reinvesting in the business. If you start from the tax return profit, the same groups of lines apply, but there is no allowance to add back and the drawings line takes out everything drawn.
1. Costs that never touch the bank
Depreciation. A real cost, because machinery wears out, but no money leaves when it is recorded, so it is added back. This is the line that makes cash look better than profit, and the one to be careful with. The manual warns against “living off the depreciation”, a business that “can only exist if it does not replace machinery when it is due.” Its verdict: “This is a quick route to becoming unviable.”
The managerial allowance. Not paid to anyone either. Add it back here, and take off what the family actually drew in the third group.
2. Timing: earned but not banked, or paid but not yet a cost
Grain and livestock on hand. Grain in the silo at year end is valued and counted as income but not yet sold. The manual treats an increase in stock numbers, such as retaining extra ewe lambs to build the flock, the same way. An increase comes off in the walk. A run-down goes back in.
Money owed to you. Pool deliveries and deferred sales count as income when delivered, but the cash comes later, and pool timing is a marketing choice rather than a harvest date. To take one pool operator, Priag, as an example: on its published terms, its 2024-25 Wheat Harvest Pool opened in October 2024 and was scheduled to make its final payment in November to December 2025, with an advance payment option paying the majority at harvest. Any increase in what you are owed comes off.
Inputs paid for but not yet used. Fertiliser bought early for next season has left the account but is not yet a cost of any crop. The manual’s example is two years’ supply of nitrogen bought on a good price, with only one year’s worth counted as an expense. It comes off.
Inputs used but not yet paid for. Chemical and fertiliser applied this season on supplier terms are a cost in the profit and loss but still in your account. This is the one timing line that usually works in your favour. Our comparison of trade credit against the overdraft prices it properly.
GST. Management budgets leave GST out, as the manual recommends. The bank account cannot. You pay GST on inputs and wait for the refund through your Business Activity Statement, and you hold GST collected on taxable sales until you remit it. Whatever is owing either way at year end belongs in the walk.
3. Cash that leaves without being a cost
Loan principal. Repaying principal reduces what you owe, a balance sheet movement rather than an expense. In the manual’s words, when measuring net profit “only the cost of borrowing capital, the interest component of the repayment, is taken into account.” On many farms principal is the largest line in the walk. Interest is both a cost and a payment, so it needs no adjustment.
Capital purchases. Machinery, silos and improvements bought with cash leave the account in full on the day they are paid for. The profit and loss only sees them gradually, through depreciation.
Family drawings. What the family actually takes out to live on. Against a managerial allowance, the net effect is the difference between the two.
Income tax and PAYG instalments. The walk starts before tax, so tax paid comes off. The ATO works out PAYG instalments from your most recent tax return and, if you pay a set instalment amount, lifts it by a GDP adjustment, 5 per cent for 2026-27. So a big season can set the instalments you pay through the following year, good or bad. Whether yours should be varied is a question for your accountant.
Farm Management Deposits. Department of Agriculture figures show primary producers held $7.04 billion in FMDs across 43,613 accounts at 30 June 2026, up from $5.93 billion at the end of March. A deposit is generally deductible when made and taxable when withdrawn. It is still your money, but it is not in the trading account, which is how a deposit made in June to manage tax can leave the account short in September. Our end of financial year guide covers the rules, including the 12 month holding period.
A worked example: $180,000 of profit, $40,000 less in the bank
Take an illustrative 2,000 hectare southern cropping farm at the end of its production year. Its management profit and loss, excluding GST and charged a $100,000 managerial allowance, shows a net profit before tax of $180,000. Over the same twelve months its trading account, including the overdraft, finished $40,000 worse off. Here is where the $220,000 went.
| Line in the walk | Adjustment | Running total |
|---|---|---|
| Management profit (net profit before tax) | $180,000 | |
| Costs that never touch the bank | ||
| Depreciation added back | +$85,000 | $265,000 |
| Managerial allowance added back | +$100,000 | $365,000 |
| Timing: earned but not banked, or paid but not yet a cost | ||
| Grain still in the silo (300 t of wheat at $300/t on farm) | -$90,000 | $275,000 |
| Pool payments and sales not yet paid | -$50,000 | $225,000 |
| Fertiliser prepaid for next season | -$25,000 | $200,000 |
| Inputs used this season, on terms not yet due | +$55,000 | $255,000 |
| GST paid on inputs, refund not yet received | -$10,000 | $245,000 |
| Cash that leaves without being a cost | ||
| Family drawings actually taken | -$115,000 | $130,000 |
| Loan principal repaid | -$90,000 | $40,000 |
| Machinery bought with cash | -$30,000 | $10,000 |
| Income tax and PAYG instalments paid | -$20,000 | -$10,000 |
| Deposited into a Farm Management Deposit | -$30,000 | -$40,000 |
| Change in the bank balance | -$40,000 | |
Illustrative figures, not a benchmark. All amounts exclude GST except the GST line itself. The bank balance is the trading account including the overdraft. Interest is not in the walk because it is both a cost and a payment.
Read that table in two halves, because they behave differently.
$150,000 of the gap is timing, and it comes back. Grain of $90,000, pool payments of $50,000, prepaid fertiliser of $25,000, a $10,000 GST refund and $30,000 in the FMD, less the $55,000 of supplier terms still to pay. The FMD sits with the cash that left without being a cost, but it is still your money and it comes back when you withdraw it. When the wheat is sold, the pool pays out and the BAS is lodged, most of it turns back into cash. Strip the timing out and this business generated $110,000 of cash in the year. It is not short of money. It is short of money in the bank.
$70,000 of the gap is permanent. Principal of $90,000, tax of $20,000, machinery of $30,000 and drawings $15,000 above the allowance come to $155,000, less the $85,000 of depreciation added back. That half does not reverse. It is decided by how the debt is structured, what the family draws and how machinery is replaced. And note the farm spent only $30,000 on machinery against $85,000 of depreciation. In a year it replaces the header, that $110,000 goes, and more.
Mixing the two halves up is costly either way. Treat a timing gap as a crisis and you sell grain you meant to hold, at a price you did not choose, to fix a problem that would have fixed itself. Treat a permanent gap as timing and you wait for cash that is not coming, while the overdraft creeps up year after year.
What the balance sheet says about the same year
Every dollar that left the bank went somewhere, mostly onto the balance sheet.
| Balance sheet item | Change over the year |
|---|---|
| Bank account | -$40,000 |
| Grain on hand | +$90,000 |
| Pool payments and sales owed to you | +$50,000 |
| Fertiliser prepaid | +$25,000 |
| GST refund owed to you | +$10,000 |
| Farm Management Deposit | +$30,000 |
| Machinery ($30,000 bought, $85,000 depreciation) | -$55,000 |
| Total assets | +$110,000 |
| Loans (principal repaid) | -$90,000 |
| Owed to input suppliers | +$55,000 |
| Total liabilities | -$35,000 |
| Net worth, before any change in land value | +$145,000 |
The same illustrative farm. Net worth rises by the $180,000 profit, less $20,000 of tax, less the $15,000 drawn above the managerial allowance, treating the tax paid as this year’s tax.
Profit of $180,000. Cash down $40,000. Wealth up $145,000. Three answers, one year, all of them correct.
If the farm is short of cash every year, it is not timing
Timing differences reverse. If your bank balance goes backwards year after year while the profit and loss says you are making money, the gap is in the permanent half of the walk.
The test: over a run of average seasons, profit after tax has to cover loan principal and any drawings above a fair managerial allowance, with depreciation kept for replacing machinery. If it does not, the overdraft is funding the difference and will keep growing until the bank asks why. Our guide to farm debt and healthy borrowing covers where the limits sit.
Why farm cash flow swings through the year
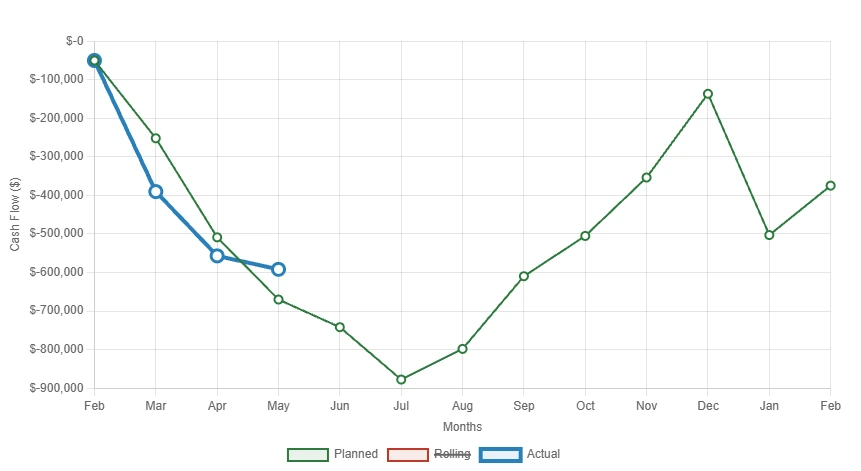
On a winter cropping farm the money goes out in one part of the year and comes back in another. The manual’s planned cash flow for Upndowns Farm shows it plainly: a maximum overdraft of about $361,000 in August, and a cash surplus of $454,000 by the end of February. Same farm, same year, same profit.
Which number you see depends on the month you look, which is also why the manual suggests drawing up the annual balance sheet at the same time each year, a few months after harvest, such as 1 March.
This season adds pressure at both ends of the country. In the south, the big crop means more grain stored and pooled than usual, so more profit sitting outside the bank over summer. In northern New South Wales and southern Queensland, where parts are in drought, it runs the other way: a smaller crop, the same overheads and a deeper trough. Our El Niño planning guide covers the dry-year case.
None of this shows up in an annual total. To see the trough rather than the year, you need the cash flow month by month, and our guide on how to build a farm cash flow forecast sets that out step by step. Here is what one looks like in P2PAgri.
Four ways to narrow the gap between profit and cash
You cannot make profit and cash the same number. You can decide how far apart they drift, and when.
Sale timing
Holding grain is a price decision and a cash decision at the same time. In the example, 300 tonnes of wheat at $300 a tonne on farm is $90,000. Carried for six months on an overdraft at an illustrative 10 per cent, it costs about $4,500 in interest, or $15 a tonne, before storage, insurance and quality risk. Holding pays only if the price rises by more than that.
The practical approach: sell enough at or near harvest to cover the outflows you already know about, such as principal, supplier terms and tax, and hold only what you can carry. Our guide to building a grain marketing plan works through how much to sell, and when.
Input terms
Supplier terms that run to after harvest move a large cost from the trough of the year to the peak. They are not free: the price on terms is often higher than the best cash price, and that difference is the real interest rate. Equally, prepaying inputs for an early order price takes cash out at the worst time unless the saving beats what that money costs on the overdraft.
Repayment structure
Principal is the largest permanent line in most walks, and its timing is negotiable in a way the season is not. Ask your bank whether repayments can fall after the main grain payments, whether a machinery purchase should sit on a term loan matched to the machine’s life rather than on the overdraft, and whether the overdraft limit covers your real peak debt. If a poor season is in the making, the manual’s advice is to talk to your banker two months before harvest.
With the cash rate lifted four times in 2026 to 4.60 per cent, and the Reserve Bank saying it will go further if needed, carrying a trough costs more than it did.
Drawings
Drawings are often the line missing from a farm cash flow, and they are the one the family controls most directly. Set them as a budget, not a balance: the manual’s Upndowns Farm draws a flat $7,250 a month, $87,000 a year. Then compare the total with the managerial allowance. Drawing less is the family reinvesting in the business. Drawing more, year after year, is the family living on equity.
Why the bank looks at all three
In the manual’s chapter on how banks lend, cash flow is the first of the Five Cs: “Cash (also often referred to as ‘capacity’) is king and always will be!” Profit and the balance sheet come in through the others. On character, “sound profit results and improving equity figures year-on-year are the best support you can offer.” On capital, “the higher your equity, the lower the risk.”
The manual’s balance sheet case study shows why a lender wants all three. A low rainfall mixed farm ran through the poor seasons of 1999 to 2008 with mostly weak or negative profits, and its debt climbed from $159,000 to $801,000. But land values rose about 90 per cent, net worth grew, and equity went from 79 per cent to 72. Because the farmer kept cash flow, profit and balance sheet records throughout, the bank could see the whole business and never refused the extra lending.
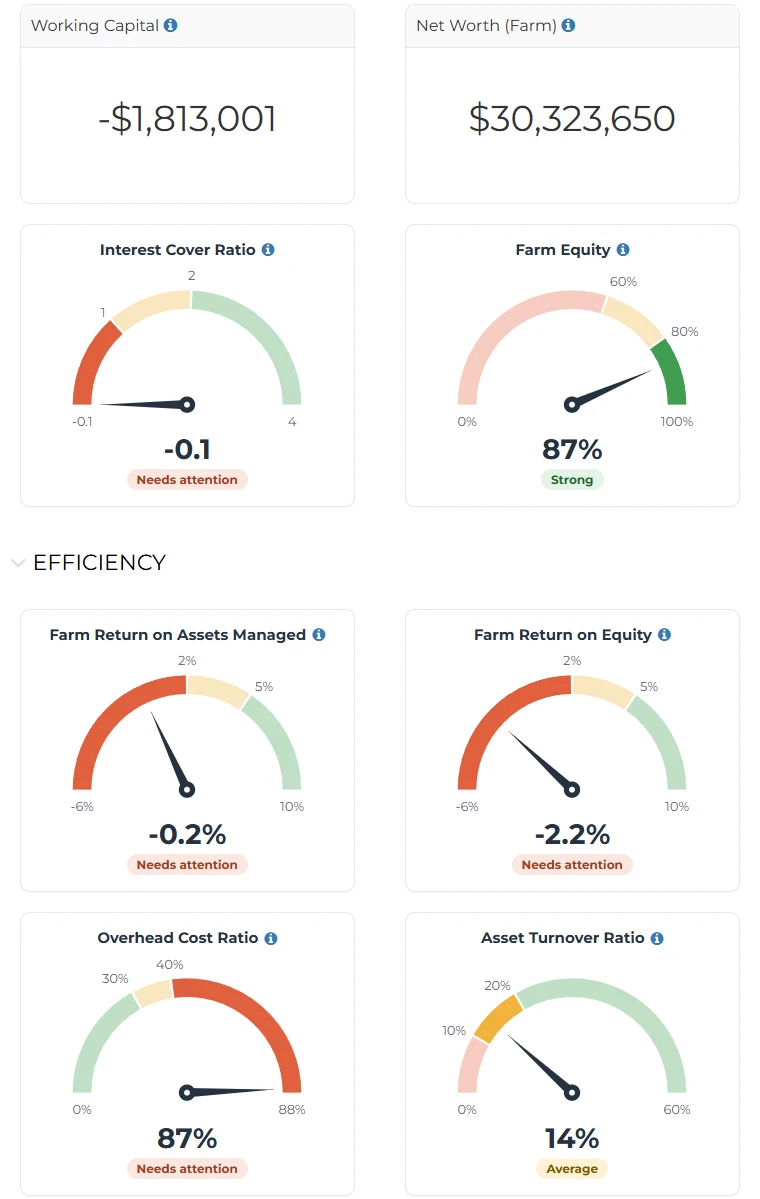
That is the honest answer to the asset rich, cash poor farm. A strong balance sheet gets you a loan. It does not repay one. Only cash does that, which is why a bank asks for a cash flow budget even from a farmer with very high equity. Our guide to what banks look for when lending to farmers goes further.
Questions to take to your accountant and your bank
- Can I have a management profit and loss on my production year, not only the tax return?
- How is grain on hand and grain in pools valued, and taxed?
- Should my PAYG instalments be varied for this year?
- Does an FMD deposit still make sense once I have looked at the cash flow through to next harvest?
- Is my principal schedule affordable from profit after tax and drawings in an average year, and if not, what are the options?
Seeing profit and cash from the same numbers
Most farmers see the two measures in different places at different times of year, which is why the gap comes as a surprise. In P2PAgri each half of the walk has its own place.
- The permanent half, on the free Essentials plan. The Management P&L, Balance Sheet and key bank ratios are built from your Xero or MYOB data, with trends across years, which is where a gap that repeats every year shows up.
- The timing half, on the Season plan. The monthly cash flow budget, with planned against actual as the season unfolds, shows the low month before you reach it, and when the grain and pool money should arrive.
The software does not make the gap go away. It puts profit and cash side by side, so the gap is something you plan for rather than discover on a bank statement.
Once the grain is sold, the walk is also the backbone of a good post-harvest business review: what the season earned, where the cash went, and what the balance sheet looks like now.
About the detail here
Figures checked as at 24 September 2026, and the cash rate as at 14 October 2026. The worked example is illustrative and chosen to show the method, not to benchmark any farm. The Farming the Business examples use 2015 figures to illustrate methods, not current prices. ABARES figures are forecasts in 2025-26 dollars. Tax treatment of trading stock, PAYG instalments and Farm Management Deposits depends on your own circumstances and structure. This is general information, not financial, tax or legal advice.
The short version
Profit tells you whether the season made money. Cash flow tells you whether you can pay the bills while it does. Net worth tells you whether the business is going forward. After a big harvest, most of the difference between profit and the bank is grain in the silo, money owed by pools, inputs prepaid and tax instalments set from last year’s return.
Walk your own numbers from profit to the bank balance, one line at a time. Sort each line into timing, which comes back, and permanent, which does not. Manage timing with sale timing and supplier terms. If the gap is mostly principal and drawings, it is a structural question, and the time to raise it with your bank is before harvest, not after.