
Post-Harvest Farm Business Review: 10 Numbers to Check Before the Bank
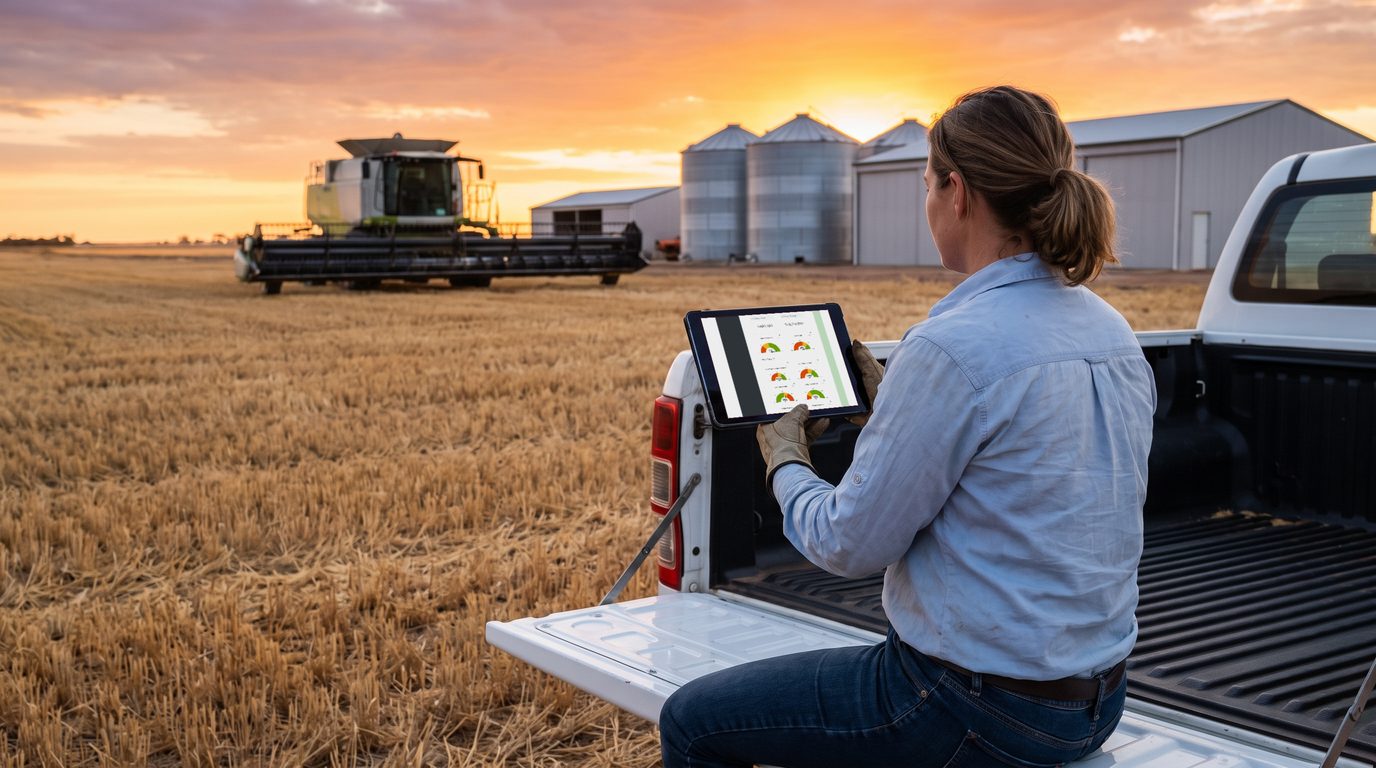
For a few weeks after the header is parked, the season’s numbers are as clear as they will ever be. You know what went into the silos, what has been sold and for how much, and what the inputs cost. By the time the bank sits down for its annual review, most of that will have blurred into tax accounts that cover a different twelve months.
That window is the time for a post-harvest farm business review. The bank will do its review either way. The difference is whether it judges you on the season just finished, in your own numbers, or on last year’s tax return, and the margin on your interest rate reflects how much risk it thinks it is carrying.
Quick Answer
A post-harvest farm business review checks what the season actually delivered against the budget, while the numbers are fresh and before the bank does its review. Ten numbers cover it: the yield, price and cost variances, cost of production, gross margins, grain on hand, cash and the next low point, bank ratios, net worth and next year’s lessons.
Then put it on one page and send it to the bank before it asks.
This season makes the review worth doing properly, because a big crop and a good year are not the same thing. In its September reports, ABARES forecast a 61 million tonne winter crop, the fourth largest on record, and forecast average broadacre farm business profit for 2026-27 to fall 39 per cent in real terms, to $133,000.
The crop was not big everywhere either: ABARES has South Australia, Victoria and southern New South Wales excellent, Western Australia about average, and northern New South Wales and Queensland poor. Meanwhile the Reserve Bank has lifted the cash rate four times this year. Your post-harvest review shows how your farm performed and gives you current figures to discuss with the bank.
The ten numbers to check in a post-harvest farm business review
| # | The number | Why the bank cares |
|---|---|---|
| 1 | Actual yield against budget | Next year’s budget yields will be tested against your history. |
| 2 | Actual price against budget | Price assumptions in a cash flow budget have to be reasonable and achievable, and a lender will test them. |
| 3 | Actual costs against budget | Costs are the variance you control. A budget that is always blown loses credibility. |
| 4 | Cost of production per tonne | It shows whether you make money at ordinary prices, not just in a good season. |
| 5 | Gross margin by enterprise and paddock | It shows which parts of the business carry the rest. |
| 6 | Grain and stock on hand, valued | Unsold grain is a current asset and next year’s income, valued at market, not at hope. |
| 7 | Cash today and the coming low point | The overdraft is sized off the low point, and a request flagged early beats a surprise. |
| 8 | The bank ratios your lender will calculate anyway | Equity, interest cover and debt servicing are standard checks at a bank review. |
| 9 | What changed in the balance sheet | Growth in net worth is the long-run test, with farming profit separated from land revaluation. |
| 10 | Lessons carried into the next budget | A budget that has visibly learned from last season is the best evidence of management a lender sees. |
Why do it straight after harvest, not when the bank asks
In Farming the Business, the manual I wrote for GRDC, I set out farm business planning as a cycle of four stages: analysis, planning, implementation and evaluation. Evaluation is the one that gets skipped. At the end of the season, performance is measured against the plan to see what worked and what could be improved, and done properly that becomes the analysis for the next season’s plan. Skip it and every budget starts from scratch.
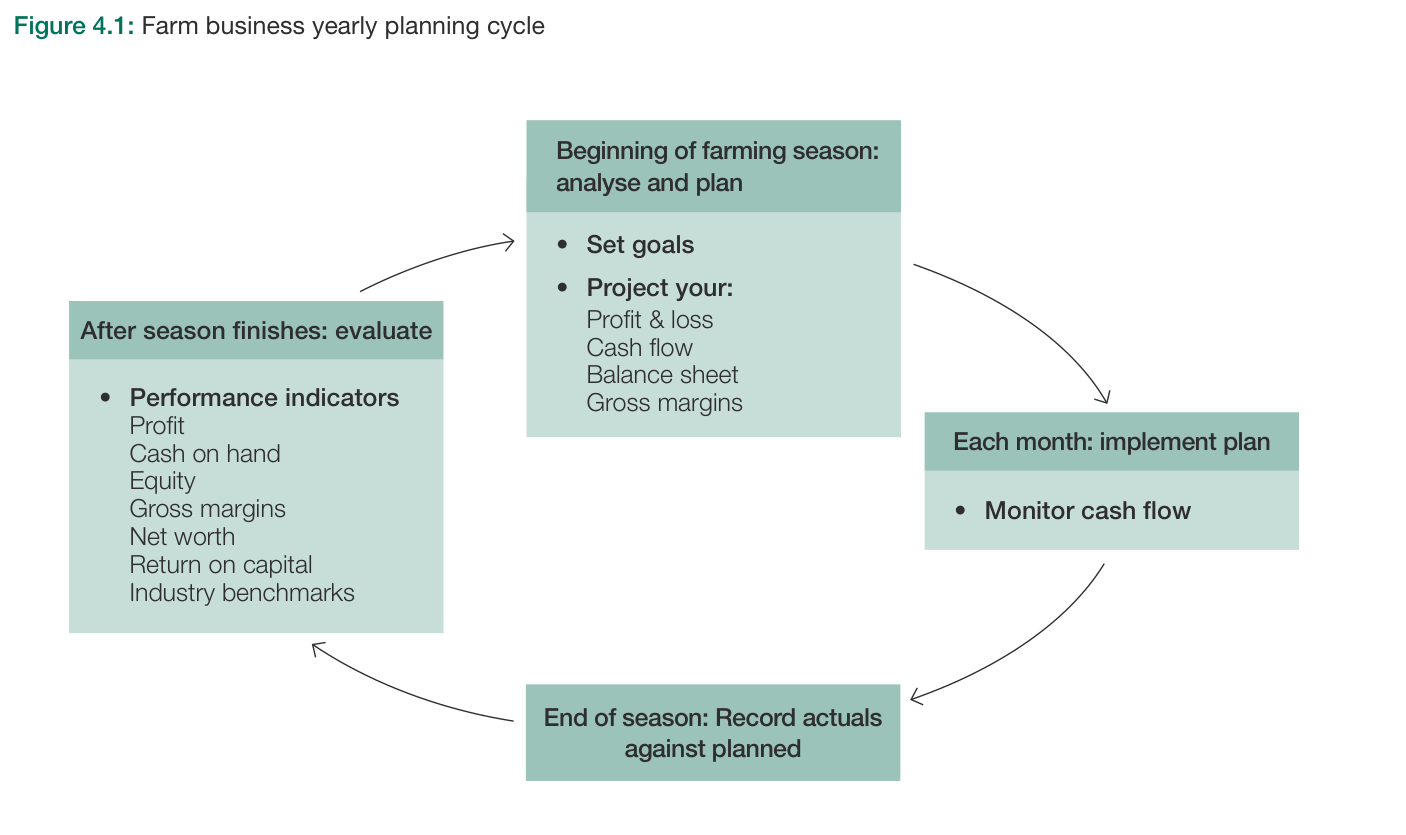
There are three reasons to do it now rather than in March.
Memory is a poor record. The manual notes that stress in tough times can get worse when performance is not measured, because memory can often be inaccurate. By autumn you will remember the yield you hoped for and the price you nearly got. The dockets and contract confirmations are easiest to pull together while they are still on the desk.
The review runs on the bank’s timetable. Its date is set by your loan, not your season: the Rural Financial Counselling Service NSW points out that the review clock starts ticking the minute your bank approves your loan, and that banks typically give 90 days’ notice. Its advice is that you do not want to be preparing for a review in the middle of harvest, nor at the end of the financial year. Do the work in the quiet weeks after harvest and you are ready whenever the letter arrives.
The bank’s accounts cover a different year. For a winter cropping business with a 30 June balance date, the accounts to 30 June 2026 hold the income from the 2025 harvest and much of the cost of putting in the 2026 crop, but none of the income from it. The manual notes that banks calculate most of their financial ratios from tax return information, and that a tax return assesses tax, not how the business is managed. Your review is the only document that shows the season just finished.
What to have on the table before you start
- The budget you set before sowing.
- Harvest tonnes and grades, by crop and by paddock.
- Grain contracts and pool statements.
- Your books reconciled to the end of harvest, in Xero, MYOB or your cashbook.
- Today’s loan and overdraft balances, with their limits.
- Last year’s balance sheet.
No budget this year? Use last year’s actuals as the yardstick. Check 10 turns this review into the budget you compare against next year.
Check 1: Actual yield against budget
Yield per hectare and total tonnes for each crop, against the budget and against your own five or ten year average. Then ask why each crop landed where it did: growing season rainfall and its decile, frost, disease, sowing date, or one paddock that dragged the average down.
Put a dollar figure on it in a way that keeps yield separate from price. The yield variance is the difference in tonnes multiplied by the budget price. It answers “how much did the season give or take” without the market muddled in.
The bank’s test of your next cash flow starts here. In the manual’s chapter on how banks lend, the cash flow test rests on reasonable and achievable assumptions for yields, prices and costs, with historical averages as the starting point and any significant variation needing to be justified. A yield record kept every year is what lets you justify it.
Check 2: Actual price against budget
Next, the average price received for each crop, net of freight, levies and receival charges, so you compare farm gate with farm gate. Value grain still in storage at today’s market and mark it unsold.
The price variance is the difference in price multiplied by the actual tonnes. Then split what the market did from what your selling did. If the whole district received less than budget, that is a planning assumption to fix. If you received less than the district, it is a marketing question, and our grain marketing plan guide is where to take it.
Check 3: Actual costs against budget
Variable costs per hectare for each crop, then overheads, then finance costs. For the big lines, fertiliser, chemical, fuel and contract work, split the difference in two: did you pay more, or use more? A price you could not control and a rate decision you could are different lessons. Our guide to managing input costs covers the levers.
The three variances on one illustrative crop
Here is how the first three checks fit together, on illustrative numbers for 1,000 hectares of wheat. They are a clean example, not a forecast.
| Illustrative wheat, 1,000 ha | Budget | Actual | Difference |
|---|---|---|---|
| Yield | 3.0 t/ha | 3.4 t/ha | +0.4 t/ha |
| Tonnes | 3,000 t | 3,400 t | +400 t |
| Net farm gate price | $370/t | $345/t | -$25/t |
| Income | $1,110,000 | $1,173,000 | +$63,000 |
| Variable costs | $430,000 ($430/ha) | $465,000 ($465/ha) | -$35,000 |
| Gross margin | $680,000 ($680/ha) | $708,000 ($708/ha) | +$28,000 |
Illustrative figures, excluding GST. Yield variance: 400 extra tonnes at the budget price of $370 is +$148,000. Price variance: $25 a tonne less on 3,400 actual tonnes is -$85,000. Cost variance: -$35,000. Together, +$28,000.
The headline says the crop beat budget by $28,000. Underneath, the season delivered $148,000 more than planned, and price and costs took $120,000 of it back. Next year the extra yield may not turn up, but the price and cost problems might. A single profit figure hides that, and it is the same shape as the ABARES forecast: a big crop does not protect the margin on its own.
Check 4: Cost of production per tonne
Farming the Business defines cost of production as the total cost to produce a unit of a commodity, including both the variable and the overhead costs attributable to that enterprise, in the unit you are paid in: dollars per tonne for grain. The crop’s variable costs, plus its share of overheads, divided by the tonnes harvested.
After harvest is when it can be done most accurately, because the tonnes are finally known. The manual is direct: at the very least, cost of production should be assessed at the end of each season. The hard part is the overhead share. The manual gives three ways to allocate it, by land area, share of gross revenue or share of gross margin, and recommends share of gross revenue for accuracy. Whichever you pick, use the same method every year.
Carry the illustrative wheat forward with a $250,000 overhead share, held the same in budget and actual. Budgeted cost of production was $680,000 over 3,000 tonnes, about $227 a tonne. The actual was $715,000 over 3,400 tonnes, about $210.
Costs went up and cost per tonne went down, because the extra tonnes spread the cost base further. The margin over cost still narrowed, from about $143 a tonne to about $135, because the price fell further than the cost did.
Now the useful question. At an ordinary 3.0 t/ha next year, the same $715,000 cost base is about $238 a tonne. That is the number for next season’s budget, not this year’s flattering $210. The manual’s bank chapter makes the same point: yield per hectare has the greatest effect on cost of production, followed by cash costs, with interest having less impact. More in our article on knowing your cost of production.
Check 5: Gross margin by enterprise and paddock
Gross margin is income less variable costs, per hectare, for each enterprise. Rank them, compare each with budget and with the last three years, and look for the one that is always at the bottom. Where you have paddock records, go a level down, because the whole-farm average hides the paddock that loses money every year.
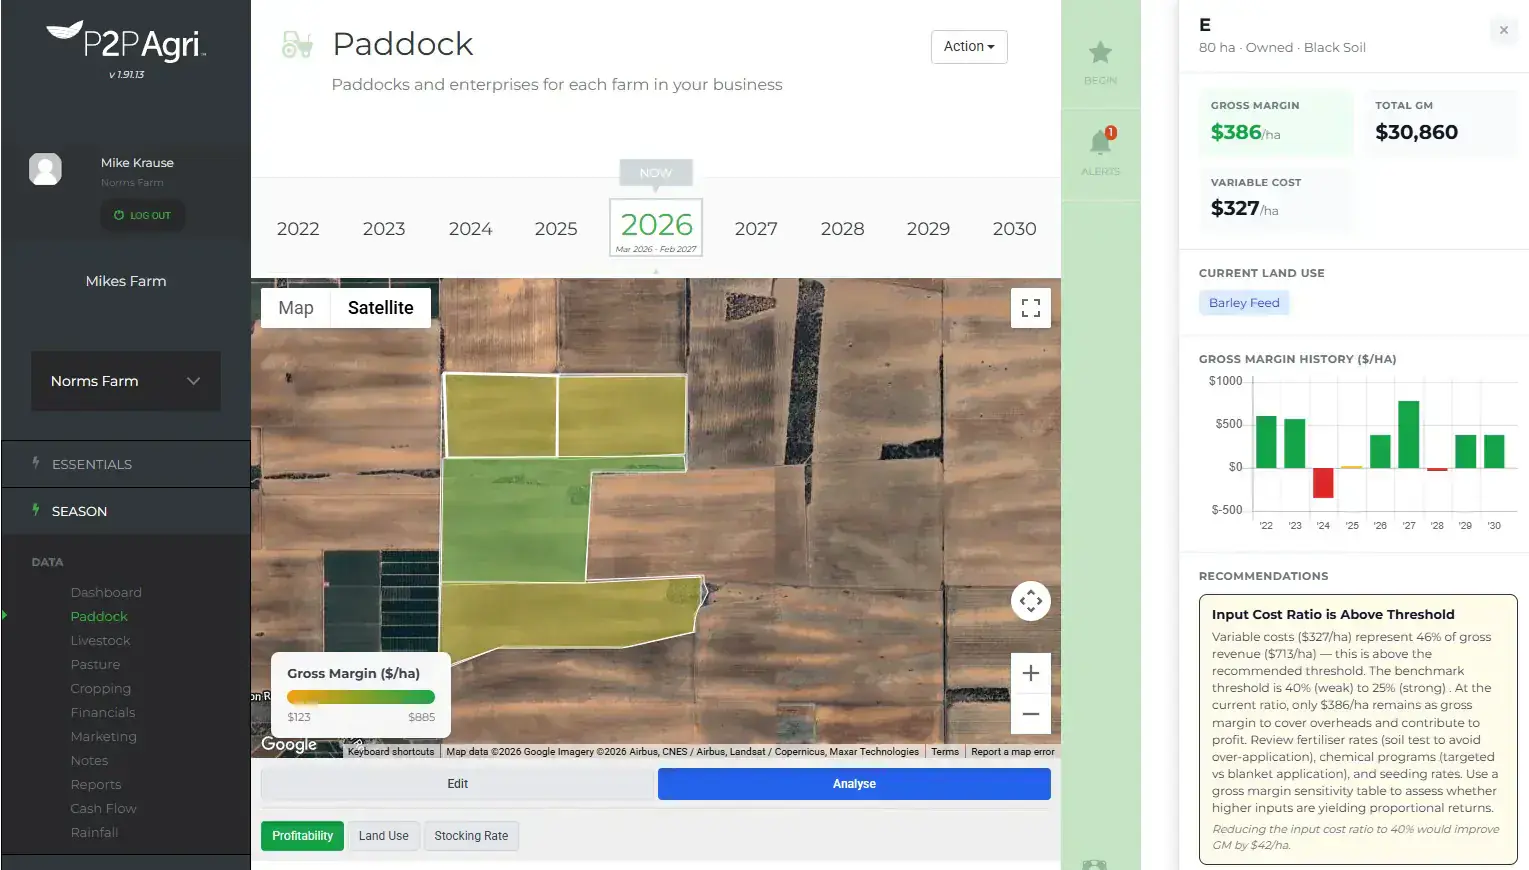
The manual’s sample farm shows why this matters in a poor season. In Table 5.20, a decile 3 year took wheat from a planned $567 a hectare to $430, and canola from $769 to $561. The self-replacing merinos came in at $775 against a plan of $768, and prime lambs at $616 against $609. The manual’s comment is that the livestock showed their value that season, a demonstration of the risk management they provide. These are 2015 figures, so take the method, not the numbers.
Check 6: Grain and stock on hand, valued
Count everything grown but not yet turned into cash: grain in silos, bags and warehouses; grain in pools or on contracts not yet paid for; livestock, class by class; and fertiliser on hand that could be sold. The manual lists livestock, unsold grain, grain in pools not yet paid for and saleable fertiliser as current assets, valued at market rates. Be conservative, net off the freight and handling still to come, and write down your method so next year is done the same way.
This matters for the profit picture. A management profit and loss counts the change in the value of produce on hand as income, which the bank balance does not. A farm that stored half its crop can show a sound profit and a thin bank balance at the same time.
It also forces the sold versus stored decision. Grain in the silo is an unpriced position that costs interest on money not yet received, plus storage and quality risk. Holding it can be right, but it should be a decision with a target price and a date, written down now.
Check 7: Cash today and the coming low point
Two figures. Today’s bank and overdraft balances. Then roll the monthly cash flow forward twelve months, with next autumn’s inputs, tax, drawings, loan principal and the timing of money still owed to you, and find the next low point and its month. Compare it with your facility limit. Our guide to building a farm cash flow forecast takes you through it.
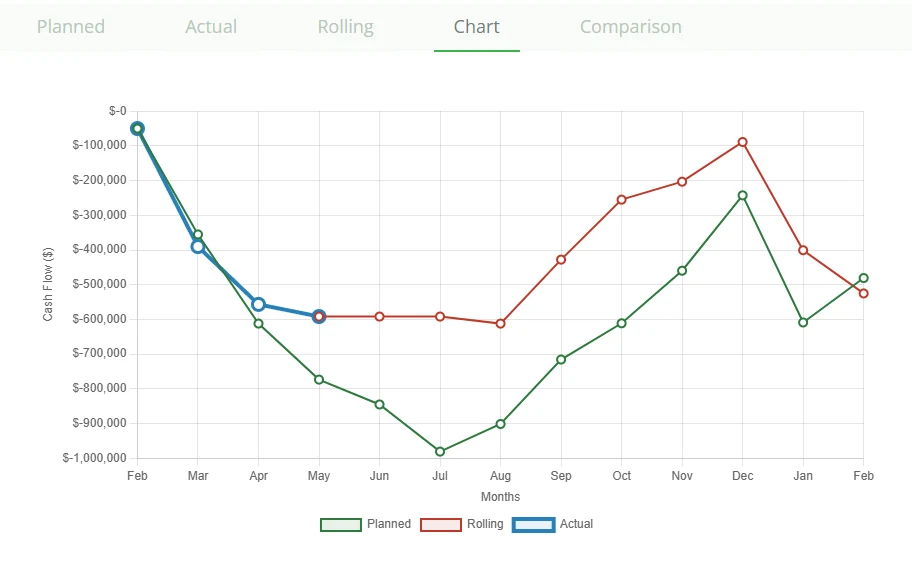
The manual’s bank chapter says cash is king, and the manual’s sample farm in Table 5.20 shows why. The budget put the peak overdraft at $369,000 in August. After a poor season and lower prices it peaked at $448,000, in September. The farm told the bank in late July, the extra overdraft was approved, and as the manual notes, because the bank was alerted early it was satisfied with the increased risk. The same $79,000 raised as a surprise in September is a different conversation.
Put interest in at today’s rate, not last year’s. With the cash rate at 4.60 per cent as at 7 October 2026, after four rises this year and with the Reserve Bank saying it will lift it further if needed, run the low point at a higher rate too.
Check 8: The bank ratios your lender will calculate anyway
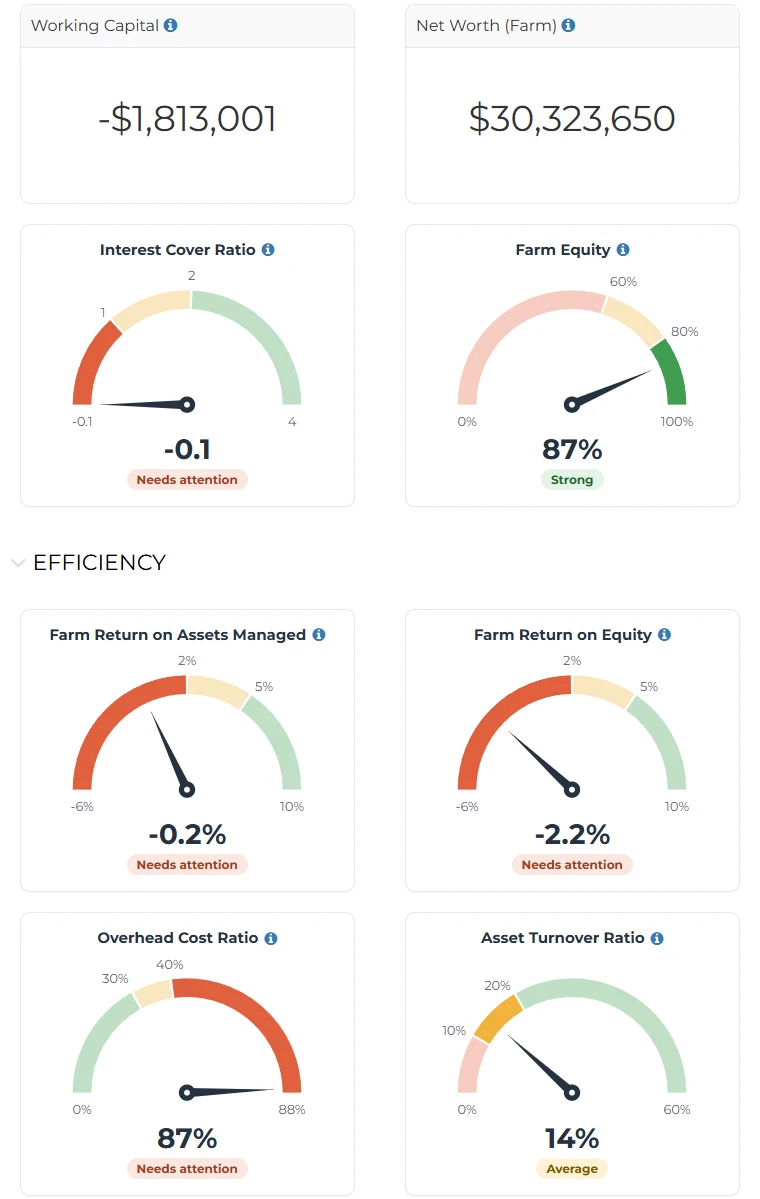
Your bank will work out most of these ratios at the review whether you do or not, and in the manual’s words it calculates most of them from information in a tax return. Work yours out first, from management figures, so you know the answer before the question. The table sets out the ones that matter most, with the manual’s weak and strong ranges and the results for its sample farm.
| Ratio | How it is calculated | Weak | Strong | Sample farm |
|---|---|---|---|---|
| Equity | Net worth ÷ total assets | Under 70% | Over 90% | 74.2% |
| Debt to equity | Total liabilities ÷ equity | Over 40% | Under 20% | 34.8% |
| Working capital | Current assets − current liabilities | Negative | Positive and stable | $1,136,800 |
| Interest cover | Operating profit ÷ finance costs | Under 1 time | Over 2 times | 2.3 times |
| Term debt and lease cover | (Net profit after tax + finance costs + depreciation) ÷ (principal and interest payments + lease costs) | Under 1 time | Over 1.5 times | 1.8 times |
| Return on assets managed | Operating profit ÷ total assets managed | Under 2.5% | Over 6% | 5.6% |
| Return on equity | Net profit before tax ÷ equity | Under 2.5% | Over 5% | 4.3% |
| Overhead cost ratio | Overheads, depreciation and family drawings ÷ gross revenue | Over 40% | Under 30% | 27.7% |
| Finance cost ratio | Finance costs ÷ gross revenue | Over 15% | Under 5% | 16.8% |
Farming the Business (GRDC, 2015), Tables 5.21 and 5.25, from P2PAgri and Hudson Facilitation. The sample farm is the manual’s ‘Upndowns Farm’ on its budgeted year. Results between the ranges sit in the middle. The manual’s operating profit is after depreciation and an allowance for the family’s labour and management, a harder test than a figure that leaves those out.
Two cautions from the manual. Ratio trends over several years are more valuable than one year in isolation. And poor ratios are not necessarily a concern if they can be explained: equity and return on equity usually dip for a few years after a land purchase, but if things have not improved after three to five years, there may be real concern.
Banks also express debt servicing in other ways, such as repayments as a share of income, which our article on farm debt and healthy borrowing covers. For why your own history is the better benchmark, see how to benchmark your farm business.
Check 9: What changed in the balance sheet
Update the balance sheet and work out two numbers. Net worth is total assets less total liabilities. Equity is net worth as a share of total assets. The manual calls net worth the most important benchmark of a farm business, puts sound equity for a dryland farmer above 70 per cent, and says your best long-term financial benchmark is growth in net worth.
Then split the change into its two sources, because a lender will. Part came from farming: retained profit, debt repaid, machinery depreciated. Part came from revaluing land and livestock, which the manual keeps separate so it does not distort the measure of how the farming performed.
Its case study shows why. On a low rainfall mixed farm through the poor seasons of 1999 to 2008, debt rose from $159,000 to $801,000, yet net worth grew considerably because land values rose about 90 per cent. The balance sheet looked fine. The farming result underneath was indifferent, and a good review says so.
The sample farm in Table 5.20 shows the other side. In its decile 3 season it missed its profit target, yet net worth grew from about $8.24 million to $8.40 million and equity from 74 to 75 per cent, largely because liabilities fell, with machinery debt paid down from $262,868 to $175,666.
On timing, for the net worth trend the manual suggests taking the balance sheet a few months after harvest, giving 1 March as an example, when most grain payments are in and the overdraft is low, and on the same date every year. So do a working version now, with grain on hand valued as in check 6, and firm it up on your fixed date.
Check 10: Lessons carried into the next budget
This check turns the review from a report into management. Write down the three biggest variances from checks 1 to 3, the reason for each, and what you are changing because of it. Then change the matching assumptions in next season’s budget:
- Yield. Your own long-run average, unless there is a specific reason not to. One big year is not a new normal.
- Price. A realistic planning price, not this season’s best sale.
- Costs. Current quotes. Rabobank said in mid-September 2026 that urea has eased from its peak of about $1,500 a tonne, but that fertiliser affordability remains a significant challenge.
- Interest and timing. Today’s rate, tested at a higher one, and payments planned as late as they actually arrived.
- Cost of production. Reworked at an ordinary yield, as in check 4, to set your target selling prices.
If you are in the north, where this winter crop was poor, or planning into the El Niño the Bureau of Meteorology declared in June 2026, which it described in late September as strong and forecast to strengthen further through spring, build the budget on a dry year first. Our El Niño planning guide covers the dry-year case, and our farm business plan template shows where the budget sits in the wider plan.
Taking it to the bank: the one-page summary
The manual’s chapter on how banks lend explains that your interest rate carries a customer margin set by how risky the bank thinks you are, judged on the five Cs: cash flow, character, capital, conditions and collateral. A post-harvest review speaks to the first three. The point the chapter asks you to remember is that the better you communicate with the bank and show it you are in control of your financial affairs, the lower the risk it sees in lending to you, and the lower the interest you pay.
Its practical advice is to know your own cash flow projections, not just hand over something your consultant prepared, to understand your historical financials, and to know your cost of production and price projections. It warns that surprise lending requests count against your character, and that sound profit results and improving equity year on year are the best support you can offer.
So put the review on one page and send it before the meeting. As the Rural Financial Counselling Service NSW puts it, banks typically give 90 days’ notice, but do not wait for them to contact you. Fill in what applies to your business.
| Line | Budget | Actual | Difference and the reason |
|---|---|---|---|
| The season | |||
| Growing season rainfall | mm, decile | mm, decile | One line |
| Production and price | |||
| Yield, by crop | t/ha | t/ha | $ yield variance |
| Net price, by crop | $/t | $/t | $ price variance |
| Sold, in pools or on contract, stored unpriced | t | t and $ at market | Selling plan for what is left |
| Profit | |||
| Gross income | $ | $ | $ |
| Variable costs | $ and $/ha | $ and $/ha | Paid more or used more |
| Gross margin, by enterprise | $/ha | $/ha | Best and worst |
| Overheads and finance costs | $ | $ | $ |
| Net farm profit before tax | $ | $ | $ |
| Cost of production, by crop | $/t | $/t | Margin over cost, $/t |
| Cash | |||
| Bank and overdraft balance today | $ | $ | $ |
| Next low point, and the month | $, month | $, month | Against the facility limit |
| Wealth and ratios | |||
| Equity | % | % | Trend over three years |
| Interest cover, and term debt and lease cover | times | times | Trend over three years |
| Net worth, and the change | $ | $ | From farming, and from revaluation |
| Next season | |||
| Three things we are changing | What each one is, and what it is worth in dollars | ||
Attach next season’s cash flow budget and, if the conversation is about new lending, a three to five year plan, which the manual also recommends taking to the bank. Our guide to what banks look for when lending to farmers covers what to put in front of the bank, and getting finance-ready walks through presenting it.
If the season went badly, the manual’s timing advice matters most. When things are going well it suggests talking to the bank twice a year. If a poor season is in the making, it says to talk to your banker two months before harvest, before their workload climbs with other clients’ trouble, and if you are in difficulty, to update them monthly.
The Rural Financial Counselling Service offers free, independent counselling to eligible farmers, including help preparing for a review, and the Regional Investment Corporation opened its Drought Hardship Loan on 31 March 2026 for farm businesses affected by drought for at least two years. Both are worth a call before the review, not after it.
Doing it with the numbers you already have
Every check here can be done with a spreadsheet, the budget you wrote in autumn and a morning with the harvest records. The discipline matters more than the tool.
If your books are in Xero or MYOB, P2PAgri does a good share of the arithmetic from them:
- Free, on the Essentials plan: the Management P&L, balance sheet and bank ratio dials, with their multi-year trend. That is most of checks 8 and 9, and a way to see your ratios before the bank works them out.
- On the paid Season plan: the monthly cash flow budget with planned against actual monitoring, which lines up budget against actual, income crop by crop and costs line by line, for checks 1 to 3 and gives the low point for check 7; enterprise and paddock gross margins for check 5; and marketing planning to track what is sold and what is still unsold.
The financial reports page shows the reports, and pricing shows which plan includes what. If you would rather not do it alone, the manual’s advice is to bring in your consultant or accountant and take them to the bank with you, or you can find an accredited P2PAgri adviser.
About the detail here
Current figures checked as at 7 October 2026: the crop forecast is from the ABARES Australian Crop Report and the farm profit forecast from the ABARES Agricultural Commodities Report, both released on 1 September 2026; the cash rate is as at 7 October 2026, after the Reserve Bank’s rise of 29 September 2026; the El Niño status is the Bureau of Meteorology’s of 29 September 2026; and the fertiliser comment is Rabobank’s of 16 September 2026. The wheat example is illustrative and excludes GST. Figures from Farming the Business are 2015 examples that show the method, not current prices or values, and its ratio ranges are guides, not bank lending rules. This is general information, not financial, tax or legal advice. Take specific decisions to your accountant, adviser or bank.
The short version
Once the header is parked, compare the season with the budget on ten numbers: yield, price and costs, each valued in dollars; cost of production per tonne; gross margin by enterprise and paddock; grain and stock on hand at market value; cash today and the next low point; the bank ratios; the change in net worth and where it came from; and the lessons for next season’s budget.
Then put it on one page and send it to the bank before they ask. A season you have already explained is a very different conversation from one the bank pieces together from last year’s tax accounts.