
Features
Farm Rainfall Tracking, Deciles and Weather Alerts
Rainfall drives crop yield, pasture growth, stocking rates and cash flow. P2PAgri tells you where this season ranks against every year since 1900 at your farm, keeps your own rain gauge records, shows a live forecast for your location, and warns you before frost, heat stress, storms or heavy rain arrive.
How Do I Record and Track Rainfall on My Farm?
Rainfall drives everything in Australian agriculture. P2PAgri holds daily rainfall for each farm location going back to 1900, from the Long Paddock SILO record, and ranks this season against it on the Bureau of Meteorology's decile scale. Record rainfall by farm, view monthly statistics, and use rainfall data to inform your management decisions.
Record Rainfall by Farm
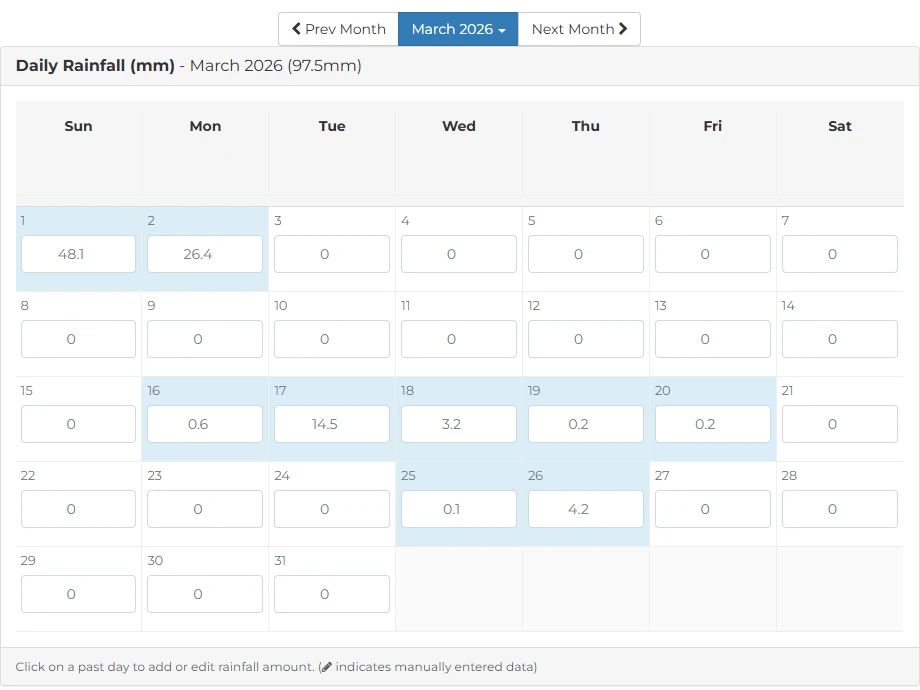
Record daily rainfall for each farm from your own rain gauge, or import a month or the full season from Long Paddock. Days you type in yourself are never overwritten by an import, and the message after an import tells you how many of your own days were kept.
Automated Weather Data
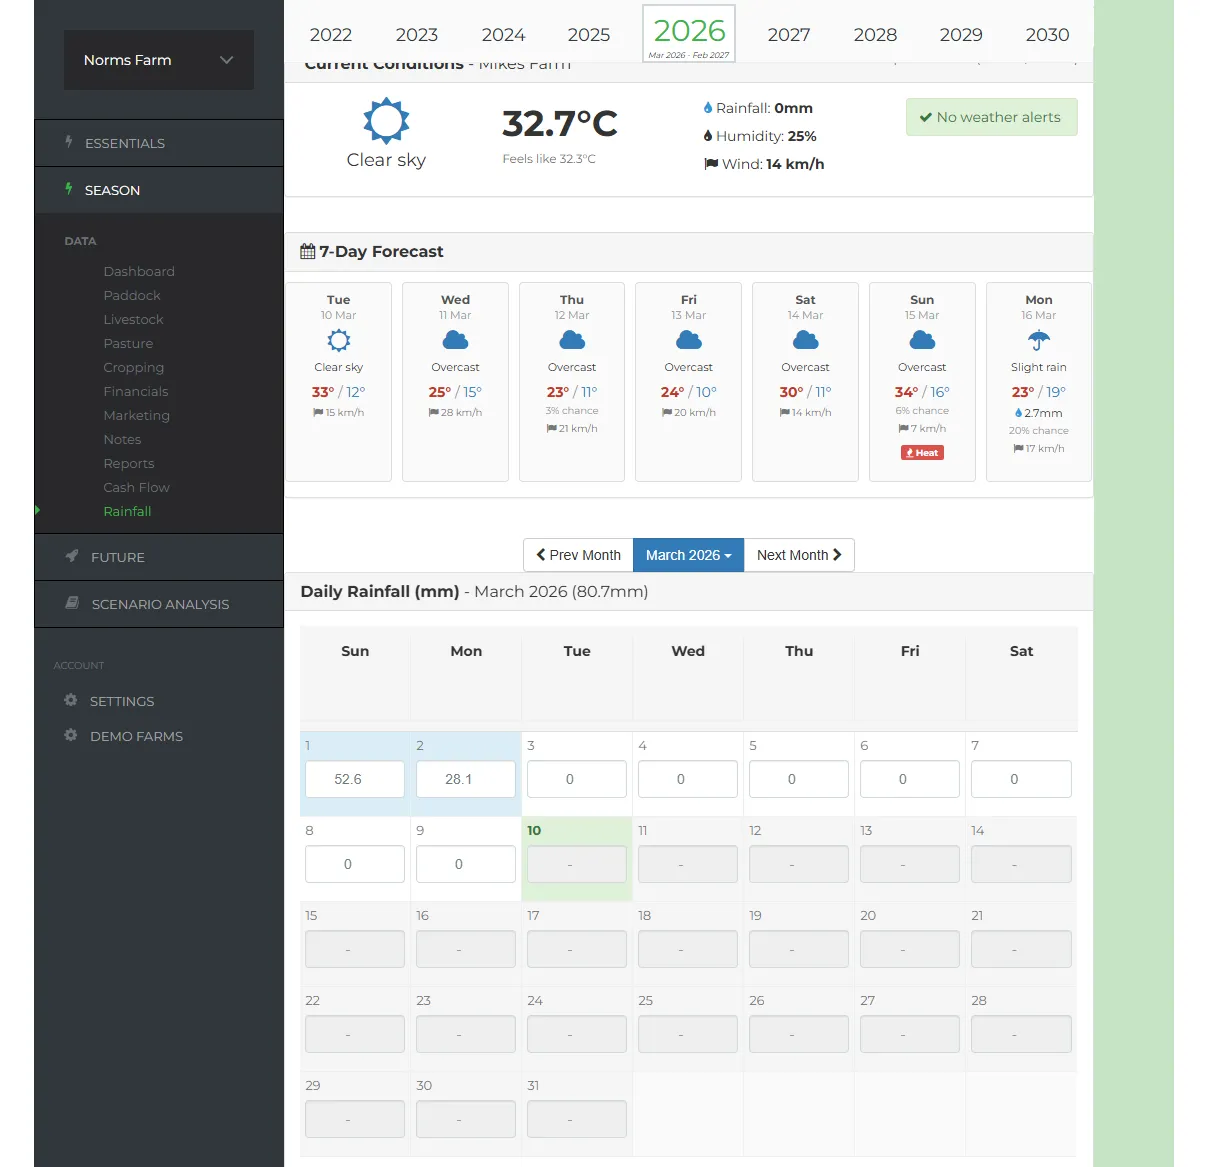
P2PAgri can pull historical and recent rainfall data automatically for your farm location, using Long Paddock SILO, the Queensland Government's climate record built from Bureau of Meteorology observations. Set your location and let the system do the rest.
How Does This Season Compare?
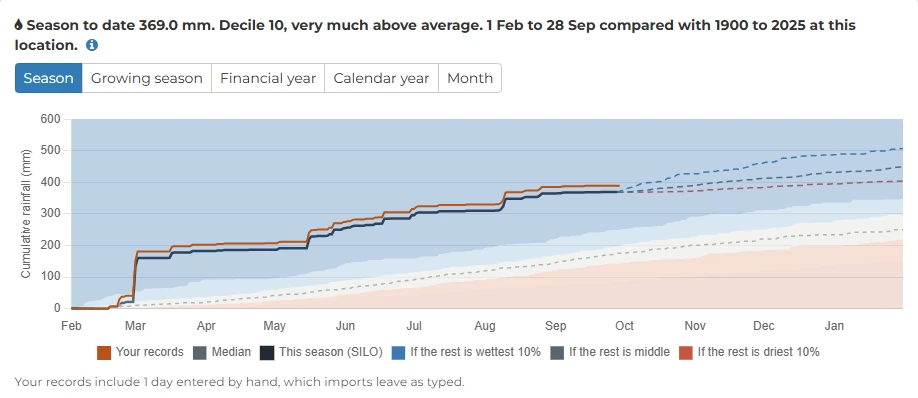
The Rainfall page ranks this season's rainfall at your farm against every year since 1900, on the Bureau of Meteorology's decile scale, and says it in one line, such as "Season to date 236.4 mm. Decile 6, average. 1 Jul to 9 Sep compared with 1900 to 2025 at this location." The season so far is only ever compared with the same dates in earlier years.
A chart shows the season's running total through shaded decile bands, with your own gauge drawn over the top and three dashed lines showing where the season would finish in a decile 1, decile 5 or decile 9 run from here. Those lines are not a forecast. Monthly bars are coloured by decile, and you can rank the season, growing season, financial year, calendar year or a single month.
Weather Alerts for Frost, Heat Stress, Storms and Heavy Rain
P2PAgri watches the forecast for your farm's location and sends you an alert when damaging weather is on the way. Alerts cover the events that matter most to Australian farm businesses:
- Frost warnings, so you can plan around frost-sensitive crops and stock
- Heat stress alerts, so you can get ahead of extreme heat before it hits your livestock
- Heavy rainfall warnings ahead of big falls
- Storm alerts before severe weather arrives
Notifications That Arrive When It Matters
Weather alerts arrive in real time inside P2PAgri, along with a live weather widget on your dashboard showing current conditions and the 7-day forecast for your farm. Because alerts are based on your farm's GPS location from your farm map, you get warnings for your property, not the nearest town.
Monthly Rainfall Statistics & Water Use Efficiency
See monthly rainfall summaries and trends over time. See how this season ranks against every year since 1900 at your location, on the Bureau's decile scale. Free tools like DPIRD's Rainfall to Date do this for Western Australian weather stations. P2PAgri does it for any farm in Australia, at the farm's own location, with your own gauge on the same chart. Rainfall data feeds directly into P2PAgri's crop water use efficiency (WUE) calculator, one of the most important benchmarks for dryland farming.
Use Rainfall Data to Make Better Farm Business Decisions
“P2PAgri is very user friendly and a great tool for running various scenarios such as crop rotations or rainfall totals before entering a new season. You can track your progress throughout the year and make price or yield adjustments as the season progresses. This provides great detail enabling farmers to evaluate their decisions and adjust accordingly.”
Hugh Murdoch
Farmer, Warooka, SA
Get Started
Rainfall tracking and deciles are on the Season plan. Draw your farm boundary on the map and the Rainfall page ranks your season straight away.
FAQ
Frequently Asked Questions
P2PAgri sends automatic alerts for frost, heat stress, heavy rainfall, and storms, based on the forecast for your farm's GPS location. Alerts arrive in real time inside the platform, so you have warning before damaging weather hits.
Historical rainfall comes from Long Paddock SILO, the Queensland Government's climate record built from Bureau of Meteorology observations, matched to your farm's GPS location from your farm map.
Automated data is a good approximation, especially for properties near weather stations. For the most accurate records, enter your own rain gauge data. You can type in your own gauge readings, and an import never overwrites a day you have typed in yourself.
Daily rainfall for your location going back to 1900, from the Long Paddock SILO record. P2PAgri uses it to rank this season's rainfall against every year on record, on the Bureau of Meteorology's decile scale.
The Rainfall page ranks the season so far against the same dates in every year since 1900 at your farm's location, on the Bureau of Meteorology's decile scale. Deciles 4 to 7 are average, deciles 2 to 3 below average and deciles 8 to 9 above average, with decile 1 and decile 10 the driest and wettest tenth of years. The line at the top of the card gives the total, the decile and the years it is compared with.
Explore More
Key Capabilities for Your Farm Business
Map Your Paddocks & Track Your Rainfall
Rainfall Deciles
Is it a decile 2 season or a decile 8? On the Season plan, P2PAgri ranks the rain that has fallen at your farm so far th...
Learn moreMap Your Paddocks & Track Your Rainfall
Farm Mapping
P2PAgri’s farm mapping tool uses Google Maps satellite imagery to let you draw your paddock boundaries, calculate areas,...
Learn moreOptimise Crop Profitability
Crop Gross Margin Analysis
Knowing your gross margin per hectare is the foundation of every cropping decision. Which paddocks are earning their pla...
Learn moreImprove Profitability for Livestock & Pasture
Pasture Management
Are you running at the right stocking rate? Too many stock and you degrade your pastures. Too few and you're leaving mon...
Learn moreTest Your Farm Business Decisions
Scenario Analysis & What-If Planning
Every major farm decision involves uncertainty. Should you buy that extra land? What happens if wheat drops to $280/t? C...
Learn more