
Features
How Does This Season's Rainfall Compare? Deciles for Your Farm Since 1900
Is it a decile 2 season or a decile 8? On the Season plan, P2PAgri ranks the rain that has fallen at your farm so far this season against the same dates in every year since 1900, on the Bureau of Meteorology's decile scale. There is nothing to enter: draw your farm on the map and the Rainfall page gives you the answer, with your own gauge drawn over the top.
What Decile Is My Season?
P2PAgri ranks this season's rainfall at your farm against every year since 1900, on the same decile scale the Bureau of Meteorology uses. The Rainfall page gives the answer in one line, such as "Season to date 236.4 mm. Decile 6, average. 1 Jul to 9 Sep compared with 1900 to 2025 at this location." The season so far is only ever compared with the same dates in every earlier year.
Decile 6 means the season sits in the sixth group up: between five and six years in ten were drier than this one. The ranking uses the Long Paddock SILO climate record for your farm's location, which is built from Bureau of Meteorology observations, so you do not need to enter anything for it to work. Any rainfall you have entered or imported yourself is drawn over the top for comparison.
The card sits on SEASON > Rainfall, below the weather forecast and above the daily rainfall calendar where your own gauge readings are kept.
See rainfall tracking, forecasts and alerts
How Does the Rainfall Decile Ranking Work?
Every year since 1900 at your farm's location is ranked from driest to wettest and split into ten equal groups. Decile 1 is the driest tenth of years and decile 10 the wettest tenth. The card describes each result in the Bureau's own words:
- Lowest on record
- Decile 1: very much below average
- Deciles 2 to 3: below average
- Deciles 4 to 7: average
- Deciles 8 to 9: above average
- Decile 10: very much above average
- Highest on record
"Compared with 1900 to 2025" means every full year from 1900 up to the last complete year. As each year finishes it joins the record, so the end year moves forward. The season so far is ranked against the same part of every earlier year: on 9 September, this season's 1 July to 9 September total is ranked against 1 July to 9 September of every year since 1900, not against whole years.
See the Whole Season on One Chart
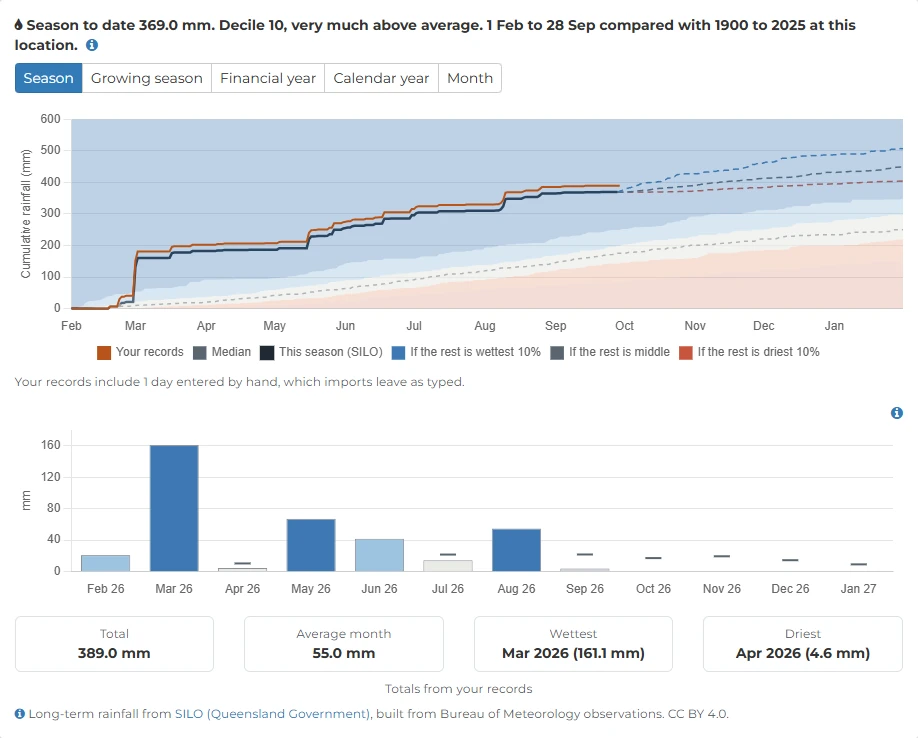
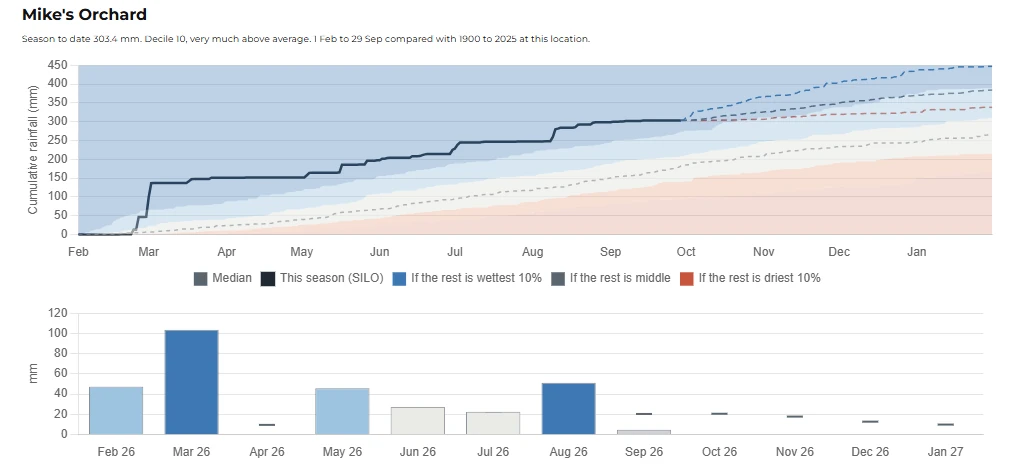
Five shaded bands run through the season, from red for the driest tenth of years, through the driest third, the middle and the wettest third, to blue for the wettest tenth. A dashed grey line marks the median, the middle year. Your season is the dark solid line running through the bands, so you can see how it has tracked since the season began.
Where you have entered or imported your own rainfall, it is drawn as a second, orange line on top, so your gauge and the long-term record sit on the same chart.
Three dashed lines run from today to the end of the season. They show where the season would finish if the rest of it comes in among the driest tenth of years (decile 1), follows the middle (decile 5), or comes in among the wettest tenth (decile 9). They are not a forecast. They show the range history allows from where the season is now, which is the range to plan around when you are weighing up inputs, stocking rates or a feed budget.
On a phone the shaded bands are replaced by three plain lines, decile 9, the median and decile 1, so the chart stays easy to read on a small screen.
Which Months Were Wet and Which Were Dry?
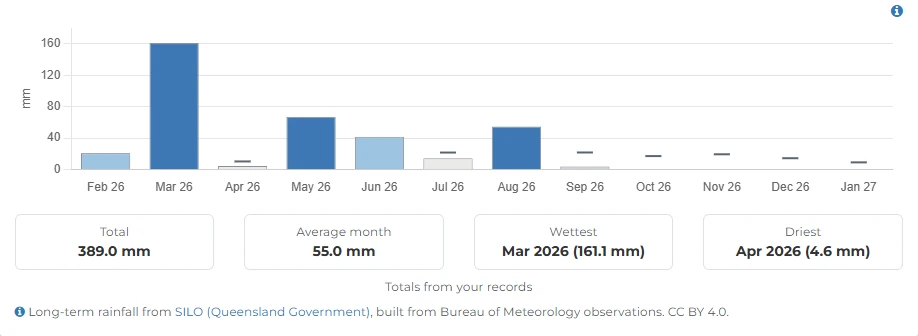
Below the chart, each month of the season has a bar tinted by its own decile, with a short grey tick marking the long-term median for that month. Hover over or tap a bar to see its decile. The current month and the months still to come are grey.
A month that is nearly always dry at your location is left grey and marked "Too dry to rank", because a decile means little when nine years in ten record almost nothing.
Four tiles show the total so far, the average month, and the wettest and driest completed months. They use your own records where the farm has any in the window, otherwise the SILO record, and the caption under the tiles says which.
Rank the Season, Growing Season, Financial Year or a Single Month
Buttons on the card change the period being ranked:
- Season: your reporting cycle, the default.
- Growing season: 1 April to 31 October.
- Financial year: 1 July to 30 June.
- Calendar year: 1 January to 31 December.
- Month: the month the rainfall calendar is showing.
Each period is ranked from its own totals. A season's decile is never worked out by adding up monthly deciles. Switching periods does not change the daily rainfall calendar below the card.
Why Is the Ranking Based on the Long-Term Record and Not My Rain Gauge?
The ranked figure is the SILO gridded rainfall for your farm's location, not your own gauge. The gridded record is the only one that runs back to 1900 for every location, and it is smoothed across roughly a five kilometre cell, so it is compared like with like against its own history.
A rain gauge on the farm is not smoothed. A storm that sits over your gauge, or misses it, shows up in full. That is why your gauge can genuinely sit a decile further out in an unusually wet or dry season. Your own figures are still drawn on the chart so you can see the difference, and the tiles use them where they exist.
Rainfall imports now keep the readings you typed in. Import Month and Import Full Season from Long Paddock fill in daily totals for the farm's location and leave any day you entered by hand exactly as you typed it. The message after an import says how many days came in and how many of your own days were kept, and the card tells you when your records include days entered by hand.
Rainfall in Your Printed Report Pack
The printed report pack has a Rainfall section. Go to SEASON > Reports, open the print option, tick Rainfall and generate. Each farm with a location gets its own block with the one-line summary, the season chart and the monthly bars for the reporting cycle, so the season's rainfall sits in the same pack as the cash flow and financial reports you take to your bank or adviser.
How Is This Different from Rainfall to Date or the Bureau's Decile Maps?
P2PAgri uses the same decile scale and wording as the Bureau of Meteorology's rainfall maps, and the comparison always runs from 1900 so the two match. DPIRD's free Rainfall to Date tool does a similar season to date comparison for Western Australian weather stations, with deciles from 1975.
P2PAgri ranks any farm in Australia, at the farm's own location, and adds:
- Every year since 1900 in the comparison
- Your own gauge drawn on the same chart as the long-term record
- Five periods to rank: the season, growing season, financial year, calendar year or a single month
- The result in your printed report pack, next to the cash flow it affects
From a Decile to a Decision
A decile only matters for what it does to the business. In P2PAgri your rainfall sits in the same place as your season plan and cash flow, so a dry or wet finish can go straight into the numbers. Revise expected yields, stock numbers or feed costs and see what they do to your cash flow, and on the Future plan build a what-if scenario for a dry finish and compare it with your current plan before you commit to inputs, sales or stock purchases.
Get Started
Rainfall deciles are on the Season plan. Create your free P2PAgri account, choose Season, draw your farm boundary and the Rainfall page ranks your season straight away.
FAQ
Frequently Asked Questions
A rainfall decile ranks a period's rainfall against the same period in every earlier year. The years are sorted from driest to wettest and split into ten equal groups: decile 1 is the driest tenth of years and decile 10 the wettest tenth. P2PAgri ranks your farm's location against every complete year since 1900, on the same scale the Bureau of Meteorology uses.
Decile 1 means the rainfall is among the driest tenth of years on record at your location, which the Bureau describes as very much below average. Decile 5 is around the median, the middle year, and deciles 4 to 7 are all described as average. Decile 10 is among the wettest tenth of years, very much above average. A season can also be the lowest or highest on record.
No. The season so far is only compared with the same part of every earlier year. On 9 September, this season's 1 July to 9 September total is ranked against 1 July to 9 September in every year since 1900, not against full years.
The ranking uses the Long Paddock SILO gridded rainfall for your farm's location. It is smoothed across roughly a five kilometre cell and is the only record that runs back to 1900 for every location. Your gauge is not smoothed, so a storm that hits it or misses it shows up in full, and in an unusually wet or dry season the two can sit a decile apart. Your gauge is drawn as the orange line on the same chart so you can see the difference.
No. The three dashed lines show where the season would finish if the rest of it comes in among the driest tenth of years (decile 1), follows the middle (decile 5), or comes in among the wettest tenth (decile 9). They only show the range history allows from where the season is now. The weather forecast for your farm is shown separately, just above the card.
Five: the season (your reporting cycle, the default), the growing season from 1 April to 31 October, the financial year from 1 July to 30 June, the calendar year, and a single month. Each is ranked from its own totals, never by adding up monthly deciles.
No. P2PAgri only needs the farm's location, and it works for any farm in Australia. Draw the farm boundary on SEASON > Dashboard, or set its location, and the Rainfall page ranks the season straight away. Entering or importing your own rainfall adds your gauge line to the chart, but the ranking does not need it.
Yes. Go to SEASON > Reports, open the print option, tick Rainfall and generate. Each farm with a location gets its own block with the one-line summary, the season chart and the monthly bars for the reporting cycle, in the same report pack as your cash flow and financial reports.
Rainfall deciles are part of rainfall tracking on the Season plan, and on the Future plan, which includes everything in Season. The free Essentials plan does not include rainfall.
Explore More
Key Capabilities for Your Farm Business
Map Your Paddocks & Track Your Rainfall
Rainfall & Weather Tracking
Rainfall drives crop yield, pasture growth, stocking rates and cash flow. P2PAgri tells you where this season ranks agai...
Learn moreMap Your Paddocks & Track Your Rainfall
Farm Mapping
P2PAgri’s farm mapping tool uses Google Maps satellite imagery to let you draw your paddock boundaries, calculate areas,...
Learn moreTest Your Farm Business Decisions
Scenario Analysis & What-If Planning
Every major farm decision involves uncertainty. Should you buy that extra land? What happens if wheat drops to $280/t? C...
Learn moreFarm Financial Planning & Cash Flow
Cash Flow Planning
Cash flow is the lifeblood of every farm business. A bumper harvest means nothing if you can't meet your repayments in J...
Learn moreOptimise Crop Profitability
Crop Gross Margin Analysis
Knowing your gross margin per hectare is the foundation of every cropping decision. Which paddocks are earning their pla...
Learn more