
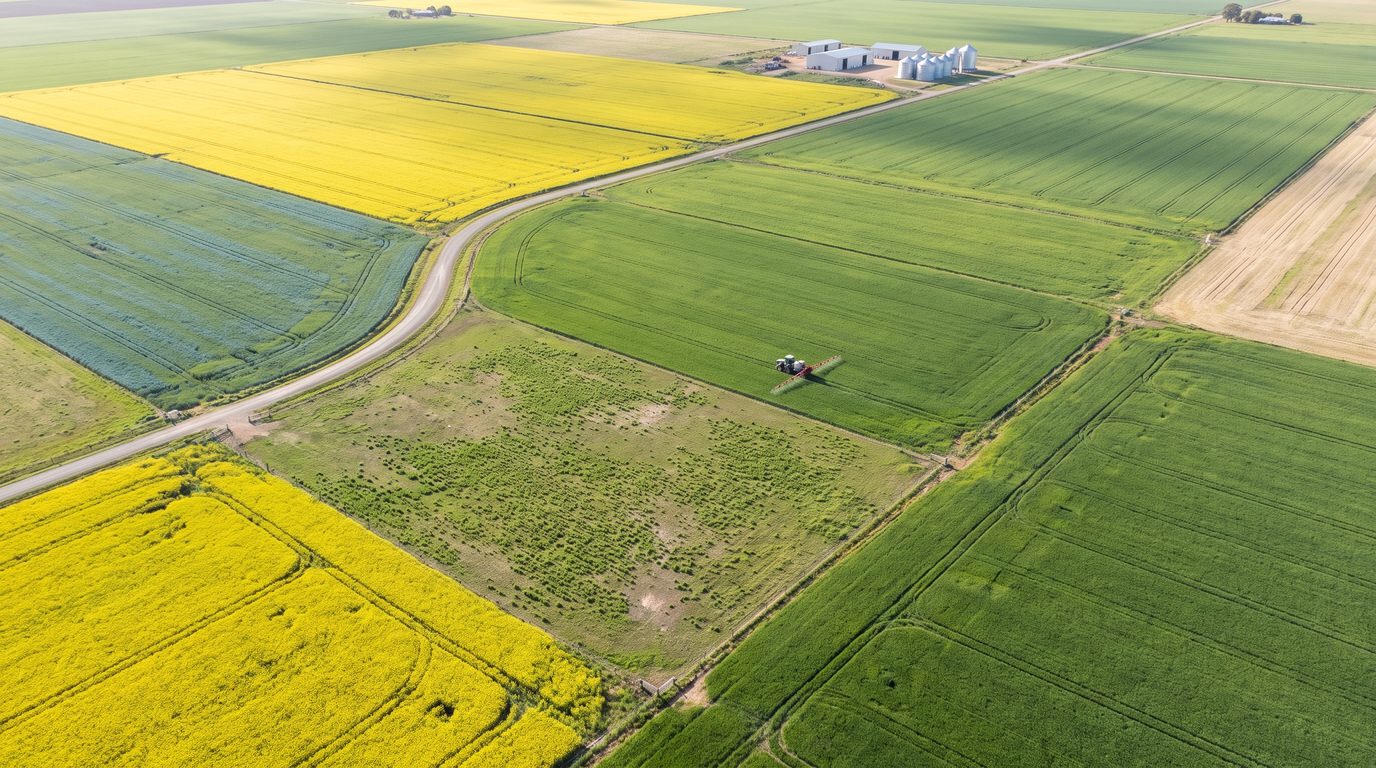
Harvest is the one time of year every paddock reports its own result, and the best time to work out gross margin by paddock. The header knows which paddock went 4 tonnes and which went 1.6, and within weeks the delivery dockets say what each load was worth. Then, on many farms, it all gets added into one gross margin for wheat, one for canola and one for the farm, and the paddock that lost money disappears into the average.
You can probably name your worst paddock without looking. Could you say what it earned per hectare, and whether that covered its share of the overheads? A paddock gross margin answers both, from records you already keep.
The gross margin budgets you can look up in Australia are averages too. The 2026 Farm Gross Margin and Enterprise Planning Guide, from the Ag Excellence Alliance with SAGIT and GRDC support, is one of the best, and it is candid: its figures represent “average case scenarios” within South Australia’s rainfall zones and “should not be relied upon as representative of any one particular situation.” NSW DPIRD publishes its winter crop budgets by zone. Both are right for comparing crops. Neither can tell you which of your paddocks paid its way.
Quick Answer
Gross margin by paddock is each paddock’s crop income (yield times price) minus the variable costs spent growing that crop on it, expressed per hectare. Rate every paddock against your overhead and finance cost per hectare: below zero is red, between zero and that cost is amber, above it is green. Judge on three seasons, not one.
In the worked example below, 45 per cent of one farm’s cropped area produced 14 per cent of its gross margin, and a healthy whole-farm average of $507 a hectare hid all of it.
Why a whole-farm average hides the paddocks that lose money
A gross margin is an average by construction. Add every hectare of wheat together and you get the wheat enterprise’s gross margin, which is exactly the right number for choosing between wheat and barley. An enterprise average can hide a sandhill paddock that has lost money for three years if stronger returns from the creek flat offset those losses.
In Farming the Business, the GRDC manual I wrote in 2015, I made a point that matters even more at paddock level: “Your gross margin calculations should reflect the management levels, soil capability, rainfall expectation and pest and weed issues of your own farm.” Soil capability and weed burden do not vary by crop. They vary by paddock.
The agronomy says the same. The GRDC-funded National Paddock Survey, led by Roger Lawes at CSIRO, monitored 250 paddocks across the northern, southern and western grain regions from 2015 to 2018. In its first-season results, only 43 per cent of northern wheat paddocks, 38 per cent of southern and 46 per cent of western reached 80 to 100 per cent of their yield potential, and no single factor explained the gap. It was “a combination of factors”, led by rainfall, nitrogen, the previous crop and root health.
Whole-farm benchmarks tell you how the business compares with others. Paddock gross margins tell you where, inside it, the result is made.
This year it matters more than usual. ABARES’ September 2026 forecasts put the winter crop at 61 million tonnes, the fourth largest on record, yet average broadacre farm business profit is forecast to fall 39 per cent to about $133,000 in 2026-27, with input prices expected to stay at historic highs. At those costs, a few poor paddocks can quietly absorb the profit from the good ones, and harvest is when you have the yields to find them.
What goes into a paddock gross margin
The definition is the one the manual uses for an enterprise: total income less the variable costs incurred in producing it. Applied to a paddock, it becomes:
The formula
Paddock gross margin ($/ha) = (Yield t/ha × Price $/t) − Variable costs $/ha
- Yield: what that paddock delivered, per cropped hectare.
- Price: the on-farm price after freight, levies and selling costs. Grain still in the silo is valued at current market value.
- Variable costs: costs that can be clearly attributed to the crop and rise with the hectares you grow, all excluding GST.
- Total paddock gross margin: the $/ha figure multiplied by the paddock’s cropped hectares.
Variable costs, in the manual’s words, are those which “can be quite clearly attributed to a certain enterprise and which increase as the scale of the enterprise increases”. For a crop that means:
- Seed, including seed kept from last harvest, valued at what it would have sold for plus grading and pickling
- Fertiliser
- Herbicides, fungicides and insecticides
- Contract spraying, spreading, windrowing and harvesting
- Crop insurance
- Fuel and oil, and repairs and maintenance on the cropping gear
- Casual labour
- Freight, levies and selling costs, either taken off the price or entered as costs, but never both
What stays out matters as much. Permanent labour, depreciation, accountancy fees, rates, interest, general insurance, rent and family drawings are incurred whichever crop goes on whichever paddock, so they are excluded. They do not disappear: they become the bar every paddock has to clear. As the manual puts it, a positive gross margin does not guarantee a profit, because it takes no account of overheads and finance costs.
How to allocate shared costs to paddocks
Allocate each shared cost by what drives it: fuel, repairs and casual labour by hectares or, better, by passes; freight and levies off the price per tonne; lime and ripping over the years they pay back; and overheads not at all, because they become the bar.
Most costs need no allocating. The spray record says what went on the sandhill, the fertiliser docket says how much urea went on the creek flat. The awkward ones come in four kinds.
Shared running costs: fuel, repairs and casual labour
The manual’s method is to take the annual bill, work out the share that belongs to the crop and divide by that crop’s hectares. In the wheat budget below, a $57,100 fuel and oil bill is multiplied by 15 per cent, the share the table allocates to wheat by area, and divided by the 277 hectares of wheat: $30.92 a hectare. Repairs of $40,070 go through the same sum to $21.70.
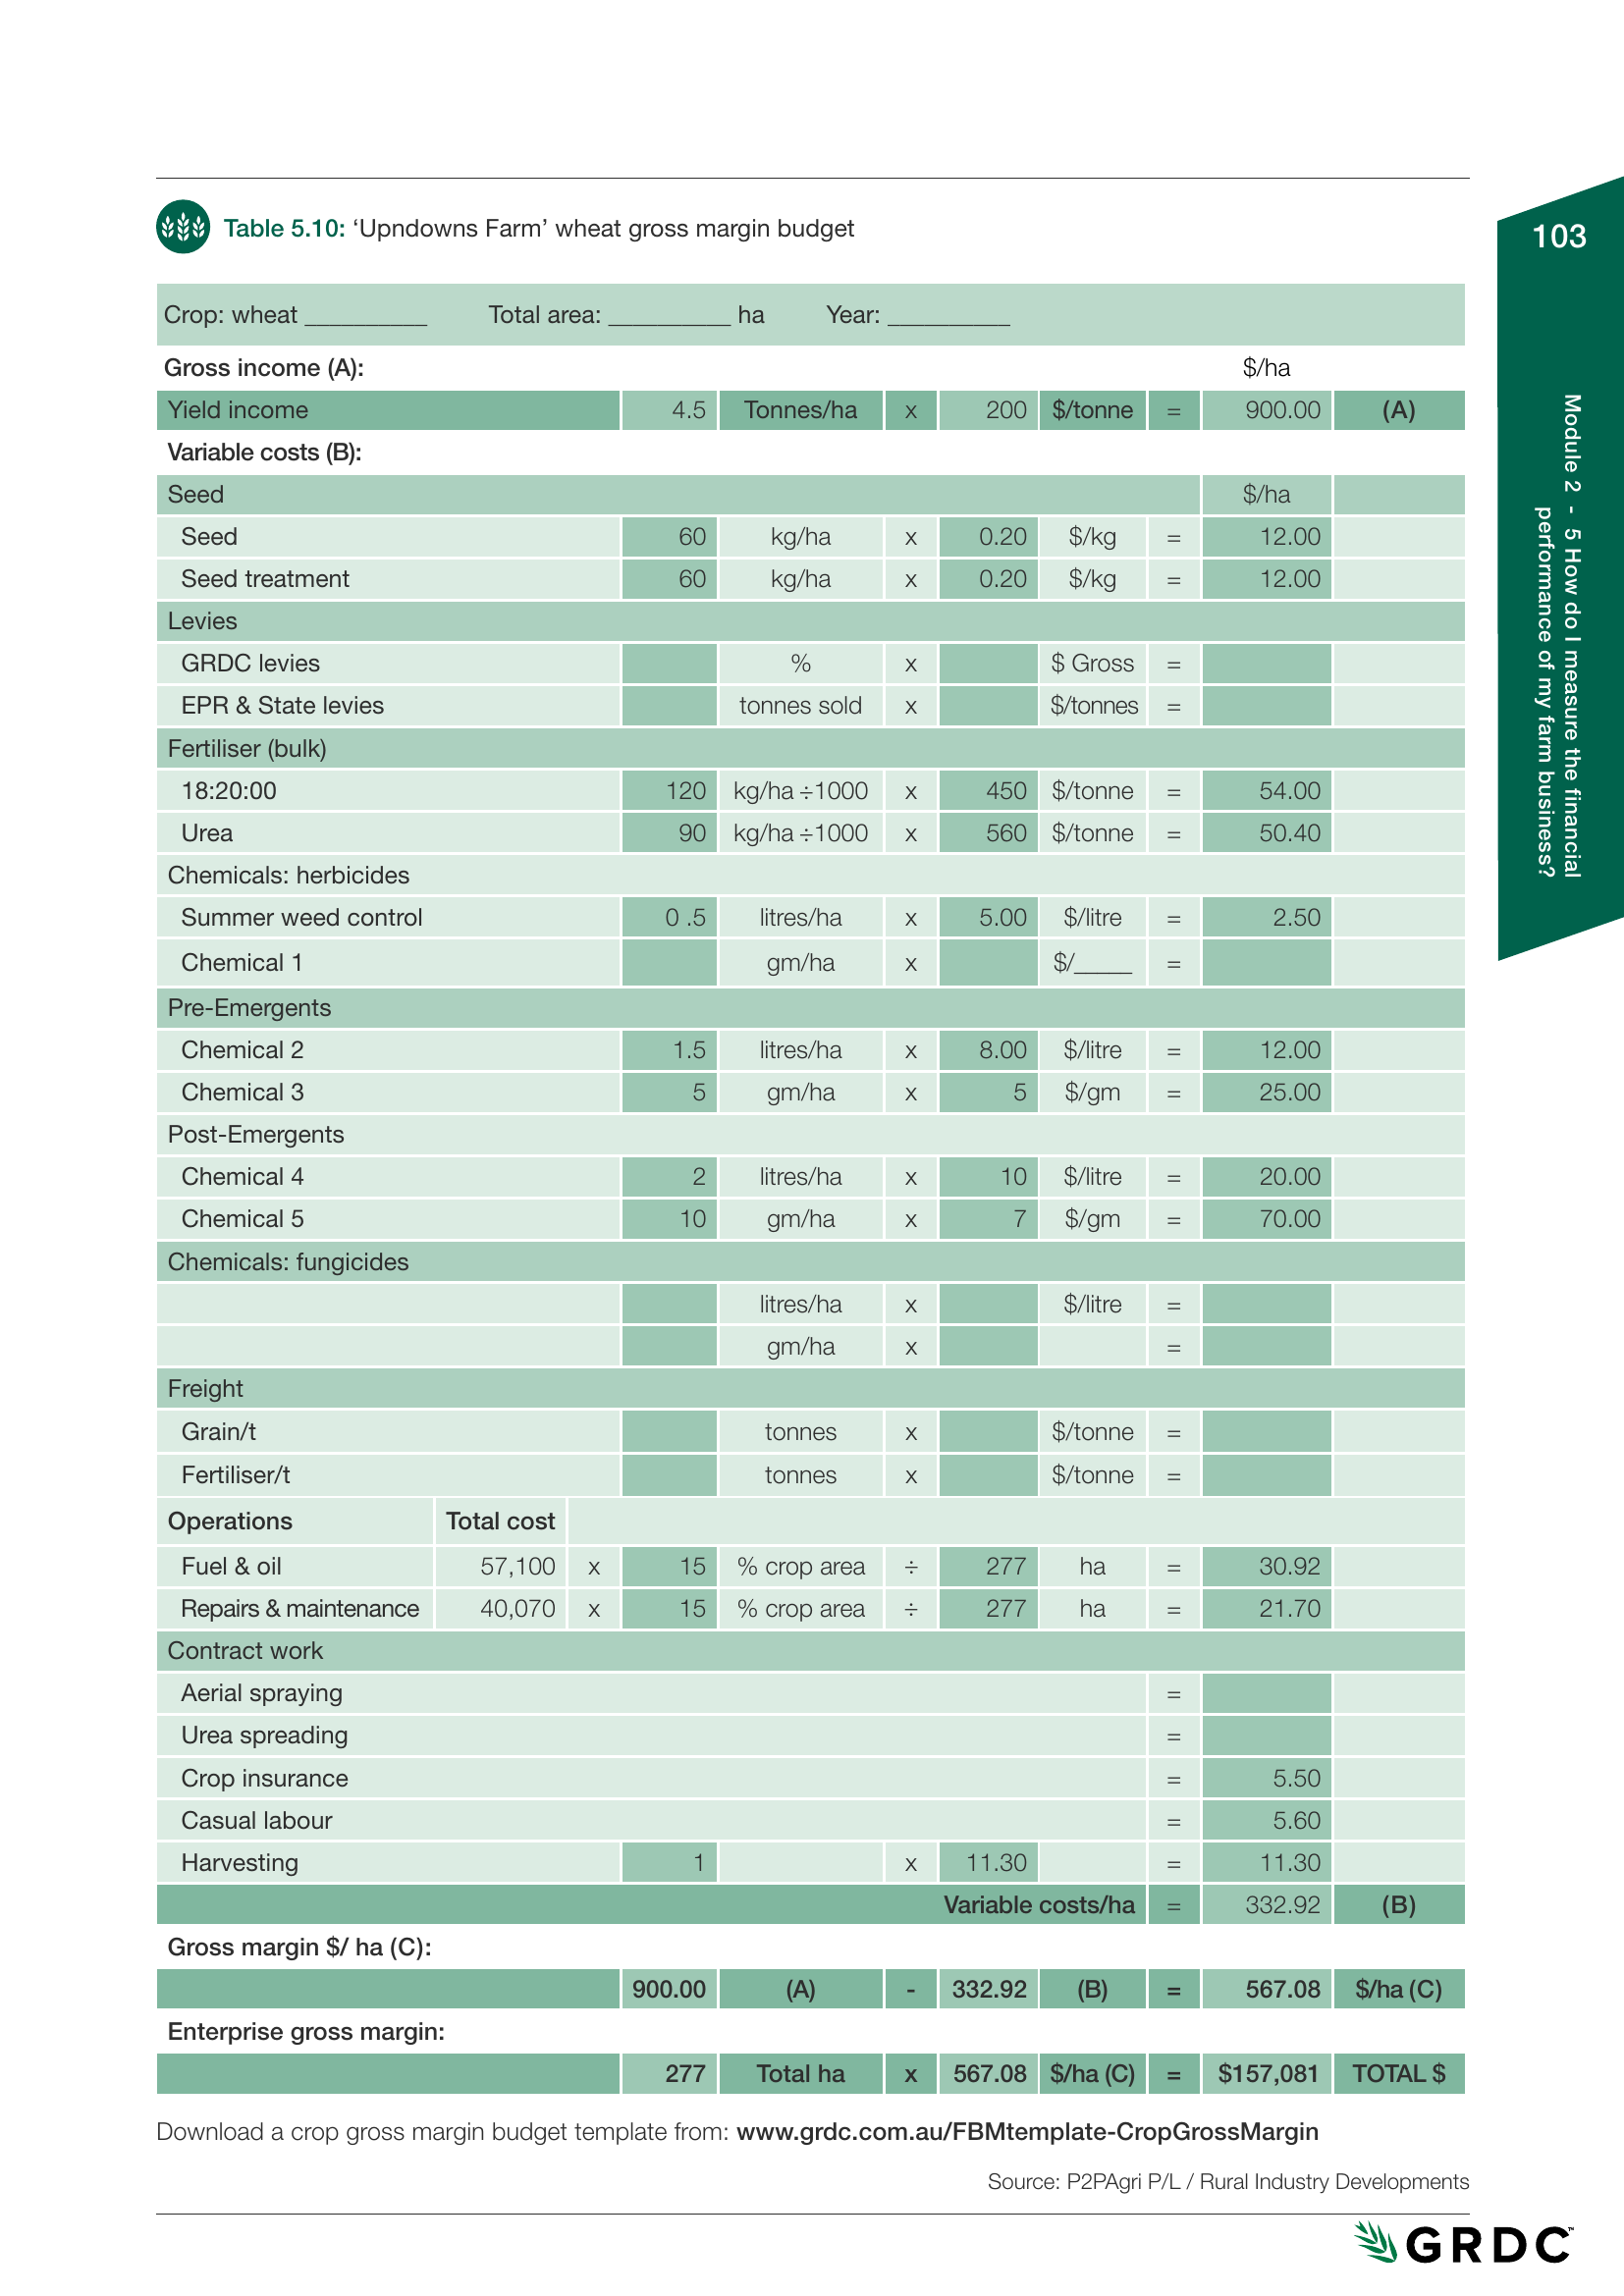
Where paddocks get roughly the same operations, that is good enough. Where they differ, allocate by passes: a paddock that took two extra spray passes used more fuel and machine hours, and a per-hectare spread hides exactly that difference. Our guide to machinery cost per hour shows how to build an hourly rate to allocate with.
Machinery depreciation and interest stay out, as ownership costs, which is also how the 2026 South Australian guide treats them. Where some paddocks are contracted, costing every operation at contract rates puts them all on the same footing.
Costs that follow the tonnes
Freight, levies, end point royalties and per-tonne harvest contracting rise with yield. The manual takes freight and marketing off the price per tonne, so they follow each paddock’s yield automatically. Just do not also enter them as costs: that double count is easy to make.
Costs that pay back over several years
Lime, gypsum, deep ripping and claying are paid for in one year and repaid over several. Load it all onto one year and the paddock looks red in the year you fixed it. Spread it over the years it works, as the South Australian guide does with lime at a tonne a hectare every five years on acidic soils. The manual does the same with occasional costs: a fungicide needed one year in three carries a third of its cost every year.
On a mixed farm, share the livestock gross margin across the pasture paddocks by the feed each supplies, measured in dry sheep equivalents, and they go on the same per-hectare scale as the crop paddocks.
Overheads: leave them out, then use them as the bar
There is no correct way to allocate overheads to paddocks. The manual sets out three options, by share of land area, gross revenue or gross margin, and each gives a different answer. You need one to work out a cost of production per tonne, but for ranking paddocks it only adds noise. Instead, use the fact that the overhead, in the manual’s words, “identifies the minimum total gross margin a farm must generate in order to break-even”. Divide total overhead and finance costs, including a living allowance, by the hectares you farm: that is what each paddock must earn to carry its share.
Worked example: six paddocks, rated red, amber and green
Here is one illustrative farm at harvest: 1,000 hectares of wheat, barley and canola in six paddocks. On-farm prices, after freight, levies and selling costs, are $330 a tonne for wheat, $290 for barley and $760 for canola, a little under late September 2026 port and track bids, and illustrative only. Overhead and finance costs, including a living allowance, are $300,000, or $300 a hectare. All figures exclude GST.
| Paddock | Crop | ha | Yield t/ha | Income $/ha | Variable costs $/ha | Gross margin $/ha | Total gross margin | Costs as % of income | Rating |
|---|---|---|---|---|---|---|---|---|---|
| Creek Flat | Wheat | 180 | 4.2 | $1,386 | $430 | $956 | $172,080 | 31% | Green |
| Home | Canola | 150 | 1.9 | $1,444 | $580 | $864 | $129,600 | 40% | Green |
| Back Paddock | Wheat | 220 | 3.0 | $990 | $380 | $610 | $134,200 | 38% | Green |
| Dam | Barley | 200 | 2.3 | $667 | $390 | $277 | $55,400 | 58% | Amber |
| Sandhill | Wheat | 160 | 1.6 | $528 | $370 | $158 | $25,280 | 70% | Amber |
| Swamp | Canola | 90 | 0.6 | $456 | $560 | −$104 | −$9,360 | 123% | Red |
| Whole farm | 1,000 | $507 avg | $507,200 |
Illustrative figures. Green: the gross margin clears the $300 a hectare overhead and finance cost. Amber: positive, but short of it. Red: below zero, so the paddock did not cover its own inputs. After $300,000 of overheads, the farm made $207,200 before tax.
Start with the bottom line, because it is where most farms stop. The farm averaged $507 a hectare of gross margin against $300 of overheads. By the whole-farm number, every paddock is doing its job.
Now read down the rating column. Three paddocks covering 450 hectares, 45 per cent of the cropped area, produced $71,320 of gross margin between them, 14 per cent of the total. Carrying their share of overheads would have taken $135,000, so they fell $63,680 short. The other 55 per cent of the farm, producing 86 per cent of the gross margin, made up the difference.
The crop averages hide it too. Wheat averaged about $592 a hectare across 560 hectares, which sounds healthy until you see Sandhill’s wheat made $158. Canola averaged $501 a hectare, and one of its two paddocks lost $104 a hectare. Neither problem shows in a crop gross margin. Both are obvious in a paddock one.
The costs-as-a-share-of-income column is a second lens. The South Australian guide lists “a disciplined approach to variable costs (less than 40% of turnover)” among its key cropping profit drivers. Home paddock sits right on that line and still produced the second-best margin on the farm, so treat the ratio as a prompt to look, not a verdict. On Dam and Sandhill, at 58 and 70 per cent, the spend looks set for a crop those paddocks did not grow.
Amber needs the most care. Dam’s $55,400 is money the farm would not have without it, and it fell only $23 a hectare short of the bar. Stop cropping it and nearly all of its $60,000 share of overheads stays put, because the header, the wages and the rates do not shrink with one paddock. Amber means watch it and work on it. Only a paddock that is red for a reason that repeats is a candidate for a change of use.
Judge paddock profitability on three seasons, not one
One harvest is one draw from the seasons. A single year’s gross margin reflects that year’s season, crop and price, and all three move. The manual’s own wheat example shows how far: move yield and price 10 per cent either way and the same gross margin runs from $396 to $756 a hectare.
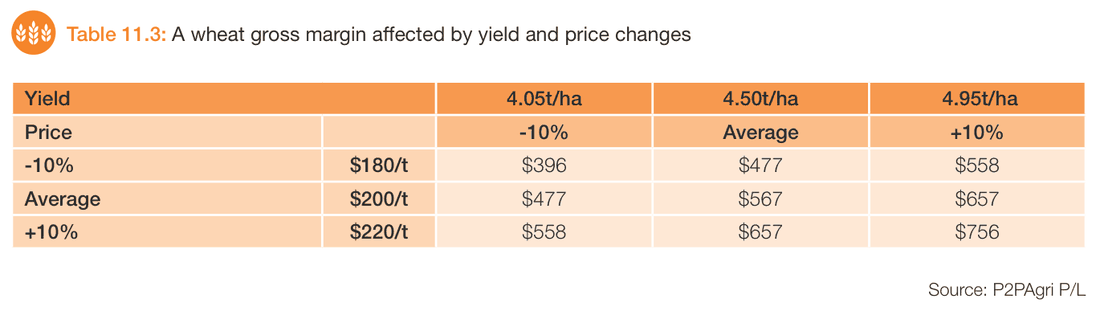
So rate paddocks on a run of seasons. Here are three paddocks from the same illustrative farm over a dry year, an average year and the harvest above.
| Paddock | Dry season | Average season | This harvest | Three-season average | Rating on the average |
|---|---|---|---|---|---|
| Creek Flat | $410 (barley) | $720 (canola) | $956 (wheat) | $695 | Green |
| Sandhill | −$60 (wheat) | $190 (barley) | $158 (wheat) | $96 | Amber |
| Swamp | $780 (wheat) | $430 (barley) | −$104 (canola) | $369 | Green |
Illustrative gross margins in $ per hectare, with the crop grown each season in brackets, rated against the same $300 a hectare overhead and finance cost.
On this harvest alone, Swamp is the paddock to fix: the only red on the farm. Over three seasons it is a good paddock that had a wet year, low heavy country that carried the farm in the dry season. Sandhill is the reverse. It was not red this year, but it has averaged $96 a hectare, about a third of what it needs to carry its share of overheads, and it lost money outright in the dry year. On 160 hectares, that is about $32,600 a year of overheads the rest of the farm has been carrying.
That is the pattern to look for. A paddock that is red once is usually telling you about the season. One that is amber or red most years is telling you about the paddock. The manual makes the same case for rotations: look at an area of the farm over time and estimate the gross margin of the whole crop sequence on it. Three seasons is a minimum; five is better.
In northern New South Wales and Queensland, where ABARES rates this season poor, this harvest will say more about the season than the paddocks. Keep the result anyway, and set it beside the next two.
Done by hand, that record is a lot of sums. The six-paddock table above is six gross margins, each built from a yield, a price and a list of costs. Three seasons of it is 18. A farm with 30 paddocks needs 90, every one worked out the same way each year or they will not compare. Keeping that record going is the hard part.
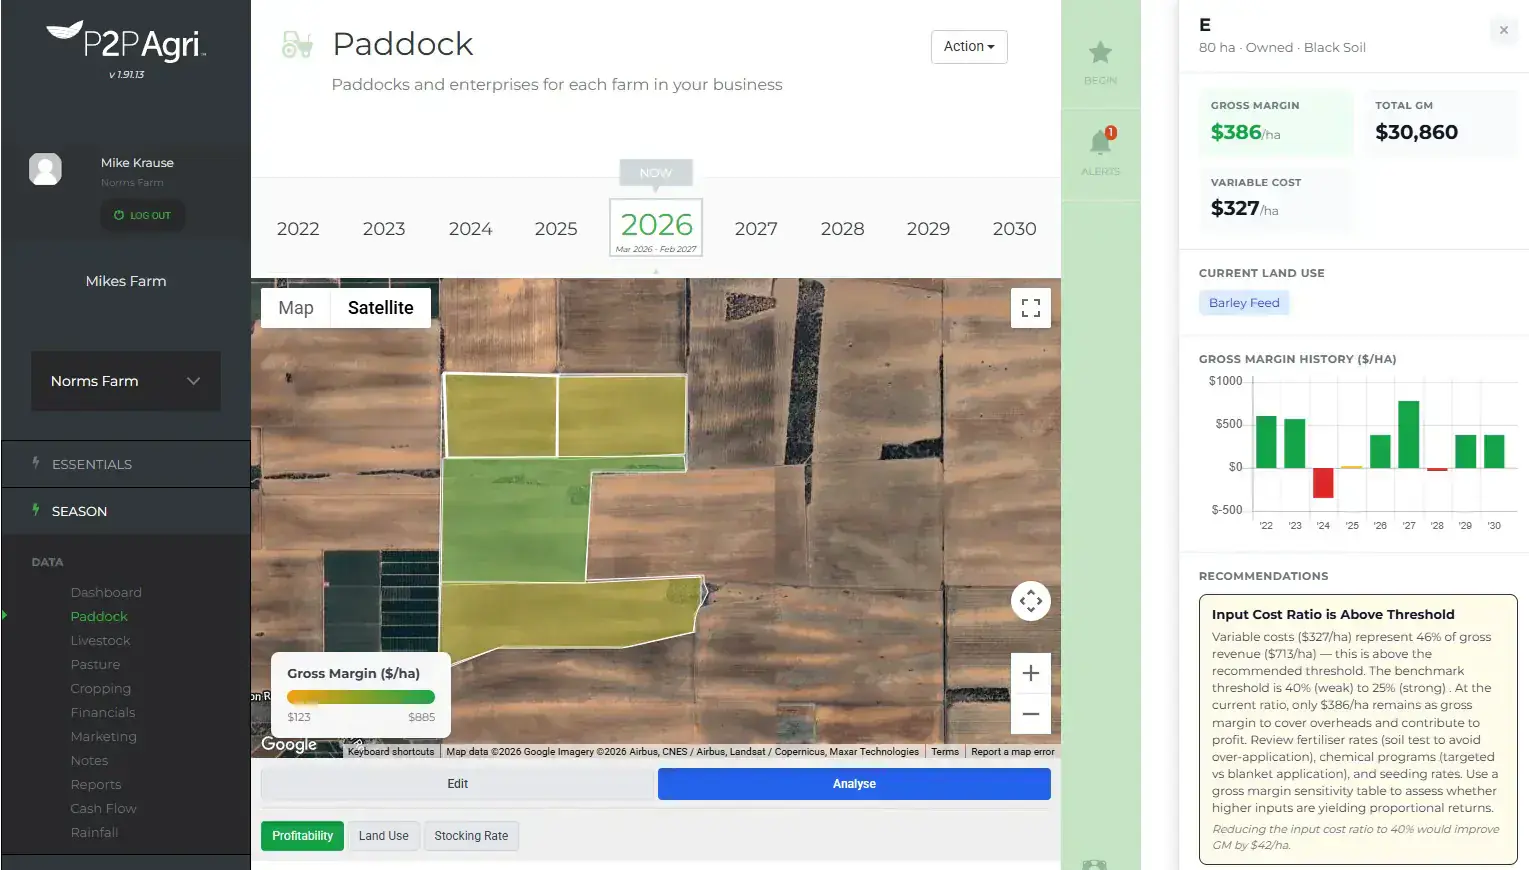
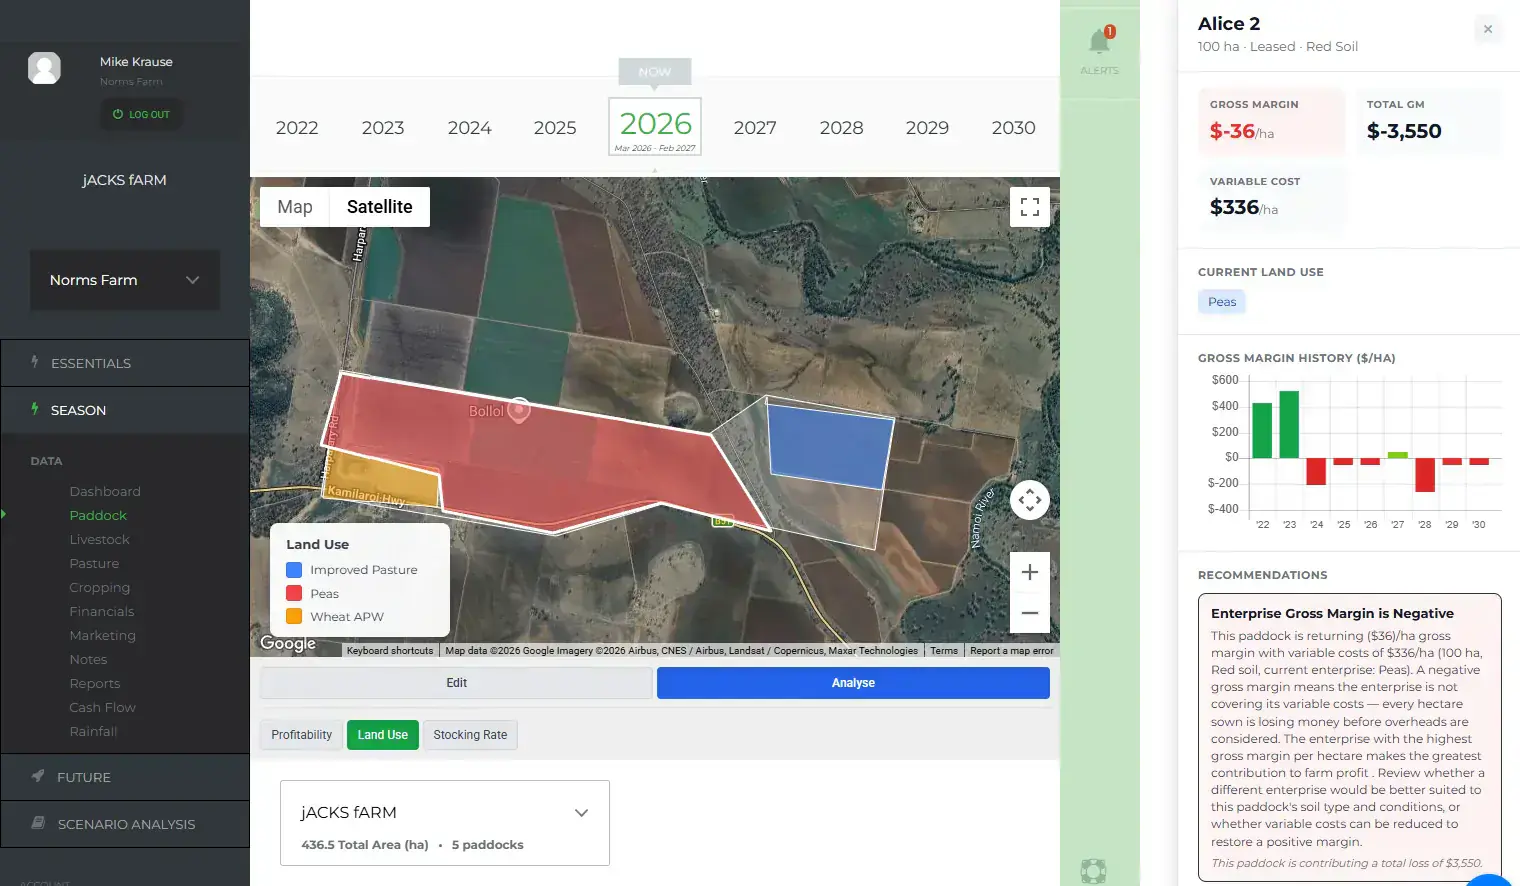
That is the job the paddock map in P2PAgri does on the Season plan. From the yields, prices and variable costs you enter, the crop gross margin tools work out a gross margin per hectare for every paddock, and the farm map shades each paddock by it. Click a paddock and its panel shows the gross margin and variable cost per hectare, a chart of its gross margin by season, past and planned, and a recommendation. The past seasons on that chart are the three-season view, without the spreadsheet.
In the example below, paddock E’s recommendation flags variable costs of $327 a hectare at 46 per cent of gross revenue, much the same test as the costs-as-a-share-of-income column in the six-paddock table. The map’s colours follow gross margin per hectare, so still rate each paddock against your own overhead and finance cost per hectare, as in the worked example.
What to do with a red paddock
“Growing the highest yield in the district may feel good at the pub, but growing the most profitable crop will always win in the end!” I wrote that in the manual about crops. It applies to paddocks too. Once one has been red or deep amber for most of three seasons, you have four broad options, best worked through with your agronomist and adviser.
Fix what is holding it back
Find out why first: soil tests down the profile, this harvest’s yield map beside last year’s, a walk with your agronomist. Acidity, sodicity, non-wetting sand, compaction and a weed seed bank all show up as lower yields on the same rain. A fix is a capital decision, so cost it that way: the extra gross margin each year against the one-off cost.
Match the inputs to what the paddock grows
A paddock that grows 1.6 tonnes should not be fertilised for four. Setting inputs to each paddock’s realistic yield is often the quickest way to turn deep amber into pale amber. On its current spend, Sandhill needs about 2 tonnes a hectare at $330 to clear its $300 share of overheads, and it has not been close. Our article on target price and target yield shows how to work back from the yield a paddock needs.
Be careful the other way. In the manual’s canola example, cutting variable costs 5 per cent added $19 a hectare, while 5 per cent more yield or price each added $57. Cutting inputs on a paddock that can yield is a false saving. Our guide to managing farm input costs covers where the real savings usually are.
Change the crop or the enterprise
Sometimes a good paddock is the wrong home for one crop: Swamp lost money in canola in a wet year and made money in wheat and barley. A lower-cost cereal, or a crop suited to the soil and drainage, can change the result on its own.
Some country is better under pasture. In the manual’s Upndowns Farm example, the self-replacing merino flock contributed as much per hectare as the best of the crops. Count what a single-year gross margin misses, too, such as stubble grazing and the nitrogen a pasture phase leaves behind. A change this size is worth testing over several years first, which is what scenario analysis on the P2PAgri Future plan is for.
Lease it out, or hand it back
If the best a paddock does over several seasons is less than someone else will pay to farm it, leasing it out may be the better use. Compare its gross margin with the rent you would receive, less anything you still pay, such as rates, and do not count saved overheads: leasing out one paddock rarely saves any.
On leased country, a paddock whose gross margin does not cover its rent year after year is a lease to renegotiate or hand back. Our article on leasing against buying farmland shows how lease rates are priced off expected gross margin, the number this exercise produces. Talk to your adviser and accountant before you sign anything.
How to work out gross margin by paddock from your own records
You do not need new records for this, just the ones you already keep, pointed at the paddock instead of the farm.
Step 1: Get the hectares right
Use each paddock’s cropped area, not the title area. A 200 hectare paddock with 12 hectares of timber, dam and waterway is a 188 hectare paddock here, and using 200 understates both its yield and its costs per hectare. Boundaries drawn on satellite imagery, or imported from a mapping program, give an area you can trust, which is what paddock mapping in P2PAgri does on the Season plan.
Step 2: Pin the yield to the paddock
The header already knows. Yield monitor data gives a figure for each paddock, but monitors drift, so calibrate the season’s total against what was delivered and weighed. With no monitor, log which paddock each truck or chaser bin load came from and reconcile it to the delivery dockets. Include grain kept on farm for seed, feed or storage.
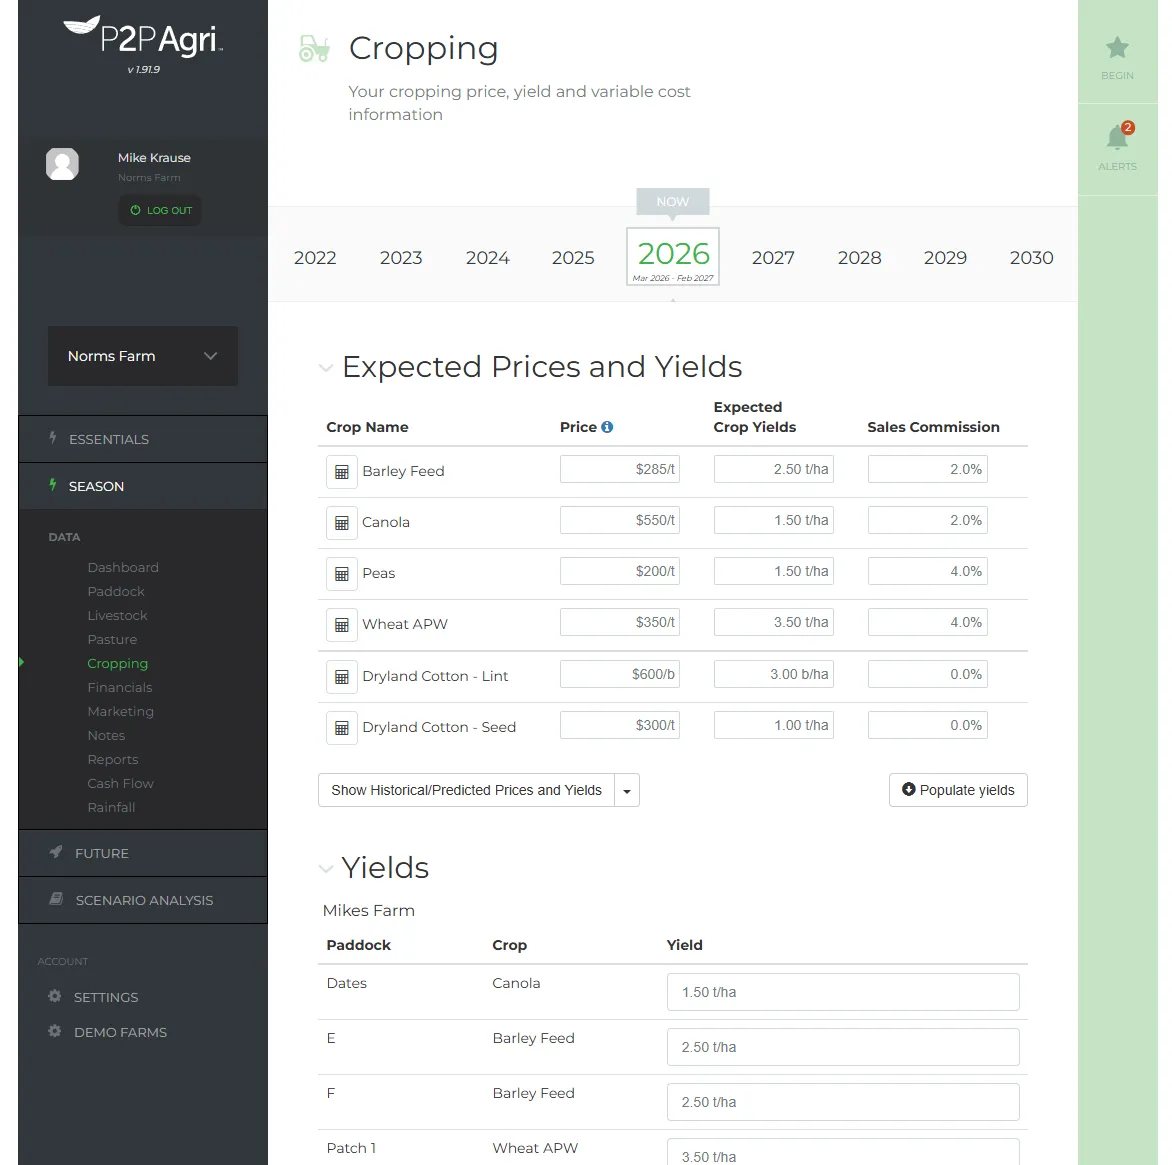
Step 3: Put a price on every tonne
Use the on-farm price: what you were paid, less freight, levies and selling costs, with unsold grain at current market value, as the manual does. Use one price per crop and grade across every paddock. A paddock that made APW while another made feed has earned the difference, but no paddock should look better because its grain filled a good forward contract. Marketing gets its own scorecard, and our guide to a grain marketing plan covers it.
Step 4: Load the costs that belong to each paddock
Work from the spray records, fertiliser and seed dockets and contractor invoices, at what you paid, excluding GST. Most of the difference between two paddocks of the same crop is yield, so costs recorded by crop already give you most of the answer. Add the paddock-specific ones that differ: the extra knockdown, the second urea, the fungicide.
In Xero, a tracking category for enterprise makes this far easier. Xero allows two active tracking categories, so enterprise and farm make a natural pair, and coding each input invoice to its crop as it arrives means the crop totals are ready at harvest. P2PAgri’s Xero integration brings your profit and loss and balance sheet in on the free Essentials plan.
Step 5: Share out the costs that cover several paddocks
Fuel, repairs and casual labour by hectare or, better, by passes. Per-tonne costs off the price. Lime, gypsum and ripping over the years they pay back. Then use the same method every year, so seasons compare.
Step 6: Rate each paddock against your overheads
Add up overheads, finance costs and a living allowance, and divide by the hectares you farm. Then colour each paddock: red below zero, amber from zero to that figure, green above it. Take the overheads from a management profit and loss, not the tax return, which uses ATO depreciation and leaves out drawings. That part is free: P2PAgri builds a management profit and loss from your Xero or MYOB data on the Essentials plan.
Step 7: Keep three seasons, then decide
Record the result every harvest and rate each paddock on its average, not its latest year. Make it part of your post-harvest business review, while the yields are fresh and next year’s program is still open. A paddock that is red once gets a note. One that is red or deep amber two years in three gets a decision.
If each harvest goes into P2PAgri on the Season plan, that record builds up as you go, and every paddock’s crop gross margin history is one click away on the farm map.
Assumptions behind the worked example
Checked as at 24 September 2026. On-farm prices of $330 a tonne for wheat, $290 for barley and $760 for canola are set below the bids in Grain Central’s Daily Market Wire of 24 September 2026: wheat $382 free in store Albany and $356 track Geelong, barley $325 free in store Albany and $295 track Geelong, and canola $875 in WA and $815 in the east. Rechecked on 22 October 2026: bids have softened with harvest selling, and the Wire of 22 October had wheat at $378, barley $318 and canola $845 free in store Albany, and wheat $345, barley $280 and canola $780 track Geelong. The illustrative barley price now sits above the eastern track bid, so read the barley rows as a western example. Variable costs, overheads of $300 a hectare and the three-season figures are illustrative, and exclude GST.
Figures from Farming the Business (GRDC, 2015) use 2015 prices and are shown for their method only. This is general information, not financial advice: take any decision to change a paddock’s use, or to lease one in or out, to your adviser or accountant.
The short version
A paddock gross margin is yield times on-farm price, less the variable costs spent on that paddock, per hectare. Leave overheads out of it, then use them as the bar: red is below zero, amber is short of your overheads per hectare, green clears them. Rate on three seasons, because one harvest tells you about the season as much as the paddock.
Then do the uncomfortable part. Find the paddocks that are red or deep amber most years, work out why, and decide whether to fix them, feed them differently, sow or graze something else, or let someone else farm them. The whole-farm average will not tell you which paddocks those are. The header already has.
Keep reading
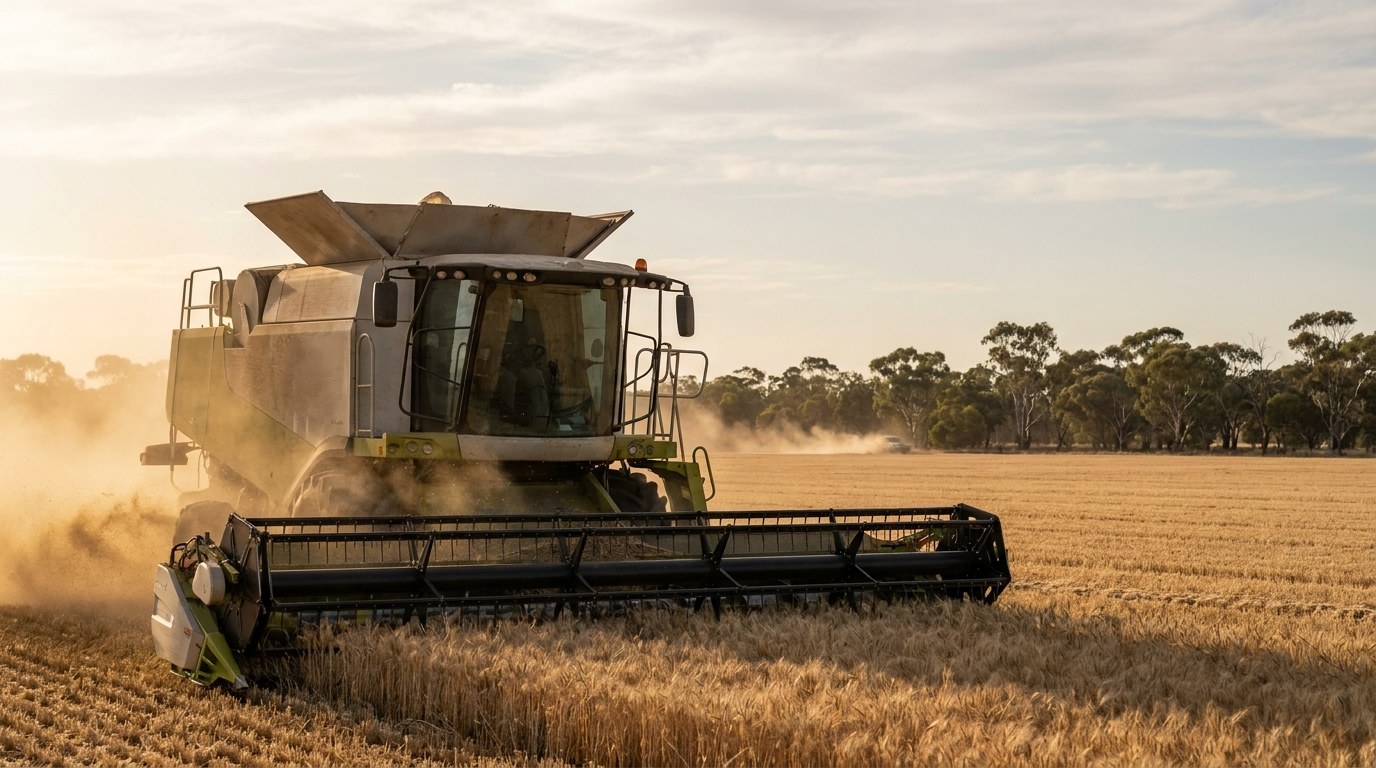
What Does Your Header Actually Cost Per Hour?
What does a header cost per hour in Australia? Machinery costs worked through in 2026 dollars: about $483 an hour at 500 engine hours, $1,565 at 100.
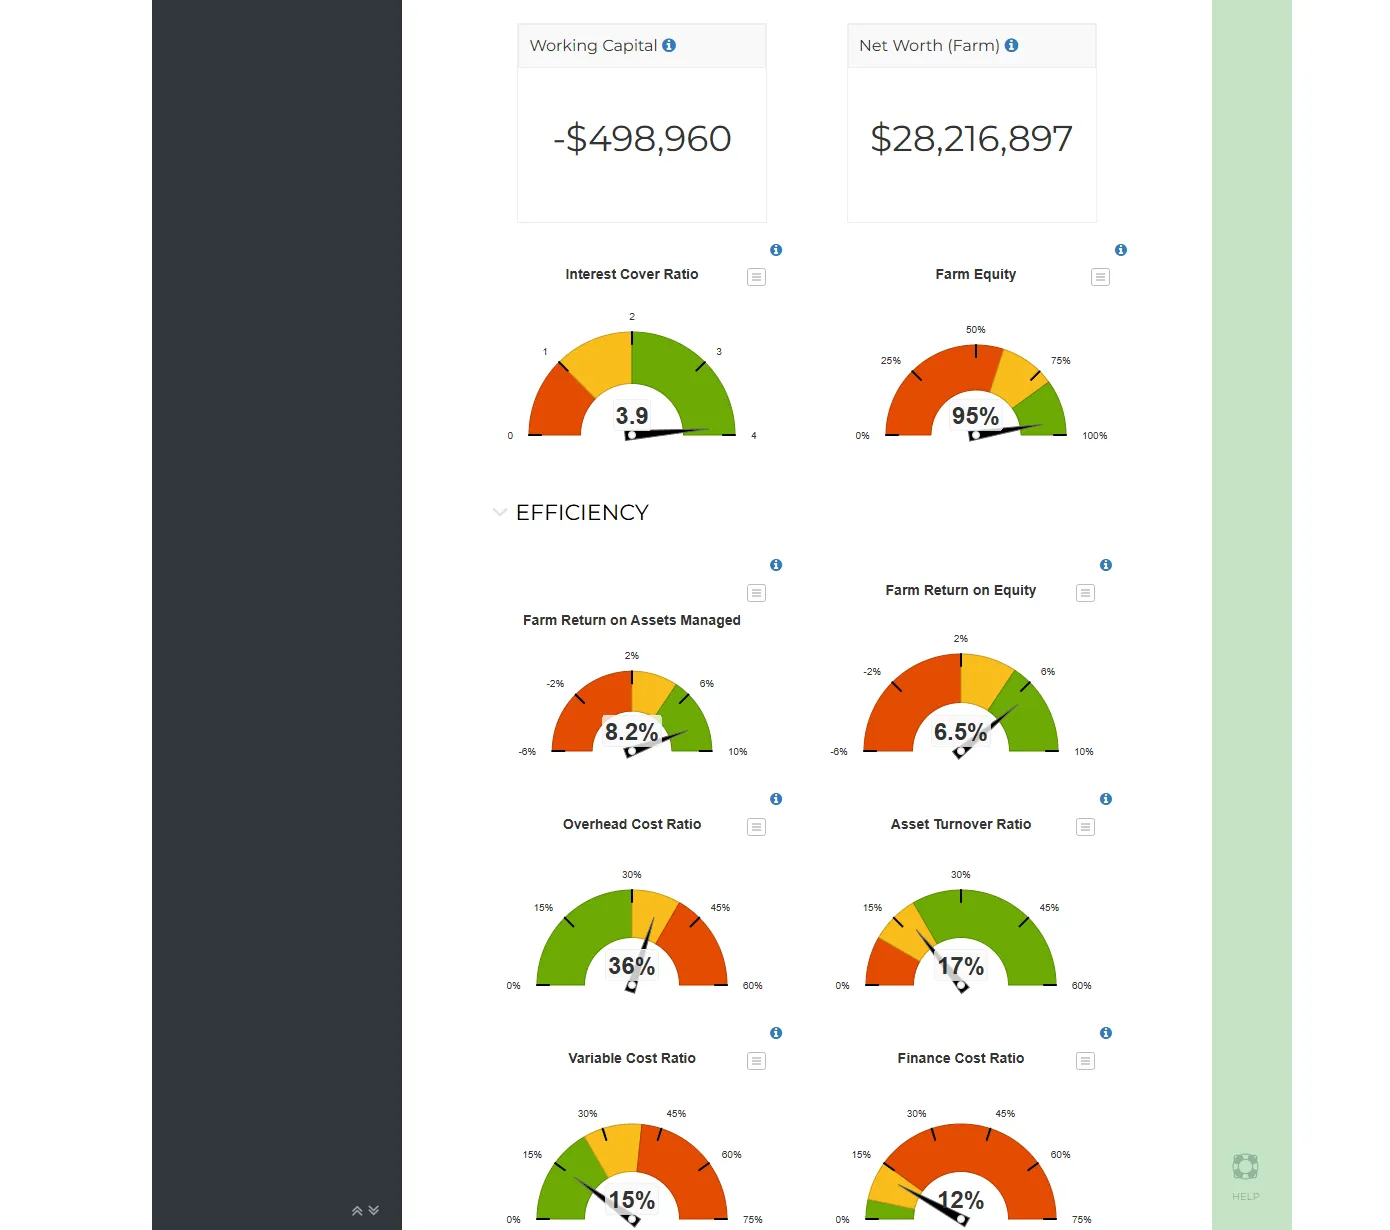
How to Benchmark Your Farm Business: The Numbers That Actually Matter
How to benchmark your farm business: six financial ratios that show whether your farm is getting stronger or weaker, and where to find improvements.
Water Use Efficiency Calculator for Grain Growers (WUE)
Water use efficiency (WUE) for grain growers: how to calculate WUE for dryland crops, what it says about paddock performance, and how to lift productivity.