
Ask what a header costs to run and you will usually get a number that is either American, out of date, or both. The most commonly cited Australian reference, NSW DPI’s Primefact 913, was first published on 1 September 2009. Everything else on the first page of a search tends to be FarmDoc, Mississippi State or AHDB, working in the wrong currency, at the wrong fuel price, in acres.
So here is the arithmetic in 2026 Australian dollars, with every assumption listed and dated so you can substitute your own. The conclusion is not really about headers. It is that the number of hours you put on a machine matters more than almost anything else about it.
Quick Answer
On the worked example below, a $900,000 Class 8 header costs about $135,200 a year to own before it turns a wheel. What that becomes per hour depends entirely on use. All figures exclude GST.
- At 500 engine hours: about $483 an hour all in.
- At 300 engine hours: about $664 an hour.
- At 150 engine hours: about $1,114 an hour.
- The crossover with a contractor sits near 180 engine hours a year against the published Class 8 benchmark of $850 per engine hour with fuel supplied by the grower, moving to about 151 hours if the machine cost $750,000 and about 202 hours at $1 million.
The two halves of the number
Every machinery cost falls into one of two buckets, and confusing them is what produces most of the bad numbers in this area.
Ownership costs accrue largely whether the machine moves or not. Depreciation, the interest or opportunity cost on the capital tied up in it, insurance, registration and a share of the shed it sits in. These are annual amounts. They become a cost per hour only after you divide by the hours you actually use.
Operating costs accrue only while it is running. Fuel, oil and lubricants, repairs and maintenance, and the operator’s time. These are per hour to begin with, and they stay roughly flat no matter how many hours you do.
That asymmetry is the whole story. One half of your cost is largely fixed and gets diluted by use. The other half does not. So a machine that sits idle is not merely under-used, it is actively expensive per hour of the work it does do.
What it costs to own the machine
Take a Class 8 header and front, bought new for $900,000 and kept five years. That price needs justifying, because it has moved: Australian rural press reported in July 2026 that typical new header values had risen from around $800,000 five years earlier to well above $1 million, with the big Class 10 and 11 machines now around $1.2 million. A Class 8 with a front sits below that, and $900,000 is a defensible mid-market figure rather than a top-of-range one. Combine sales tell the same story from the other direction: 1,145 units in 2022 and 1,061 in 2023, down to 696 last year.
Assume it is worth 55 per cent of new at trade, and that capital costs 7 per cent whether that is a finance rate or the return you would have earned on the money elsewhere.
| Ownership cost | How it is worked out | Per year |
|---|---|---|
| Depreciation | ($900,000 − $495,000 resale) ÷ 5 years | $81,000 |
| Interest / opportunity cost | Average capital of $697,500 × 7% | $48,825 |
| Insurance, registration, shedding | 0.6% of purchase price | $5,400 |
| Total ownership cost | Before it turns a wheel | $135,225 |
One simplification worth naming, because it is doing real work below: the 55 per cent resale is held constant across every hours figure in this article. In practice a low-hours machine trades better than that and a high-hours machine worse, because some depreciation is driven by use rather than by time. Australian work on tractor and header depreciation by Tozer concluded that machinery depreciation is both a fixed and a variable cost. Treating it as wholly fixed overstates the penalty at low hours somewhat. The direction of everything below survives that correction; the steepness of the curve is flatter than shown.
What it costs to run it
Operating costs are per hour from the start. The fuel figure is the one most often got wrong, because the pump price is not what diesel costs a GST-registered farm business.
| Operating cost | Assumption | Per engine hour |
|---|---|---|
| Fuel | 55 L/hr at $1.95/L, being the pump price ex GST less the fuel tax credit | $107.26 |
| Oil and lubricants | 10% of fuel | $10.73 |
| Repairs and maintenance | A five year average, back-loaded in reality | $50.00 |
| Operator | A real rate on the seat, yours or an employee’s | $45.00 |
| Total operating | Flat, whatever the hours | $212.99 |
The fuel line is worth showing in full, because it is where most machinery costings go wrong. National average retail diesel was 273.6 cents per litre in the week ending 20 September 2026, on the Australian Institute of Petroleum’s weekly figures, up from 248.3 cents a month earlier. It jumped when the temporary excise reduction ended on 2 August and has kept climbing as international diesel prices rose. That is a GST-inclusive pump price. A GST-registered farm claims the input tax credit, so the real starting point is 248.7 cents. From 3 August 2026 the off-road fuel tax credit for diesel is 53.7 cents per litre, and a header working in a paddock qualifies for the full off-road rate with no road user charge deducted. That leaves $1.95 a litre. If you are costing machinery at the pump price you are overstating fuel by around 40 per cent. Diesel is also the input most likely to have moved again by the time you read this, so check the current price before you rely on the fuel line.
Cost per hour, and why low hours are the real killer
Now put the two halves together across a range of annual use. Nothing about the machine changes between these rows.
| Engine hours per year | Ownership cost per hour | Operating cost per hour | Total cost per hour |
|---|---|---|---|
| 100 | $1,352.25 | $212.99 | $1,565.24 |
| 150 | $901.50 | $212.99 | $1,114.49 |
| 200 | $676.13 | $212.99 | $889.12 |
| 300 | $450.75 | $212.99 | $663.74 |
| 400 | $338.06 | $212.99 | $551.05 |
| 500 | $270.45 | $212.99 | $483.44 |
The machine at 100 hours costs more than three times as much per hour as the same machine at 500 hours. That is not a difference in the machine, the operator or the season. It is arithmetic, and it is the single most important fact about machinery economics.
Farming the Business, the GRDC manual written by P2PAgri’s Mike Krause and published in 2015, makes the same point with a tractor. The dollar figures are of their era, but the shape of the arithmetic has not aged at all.
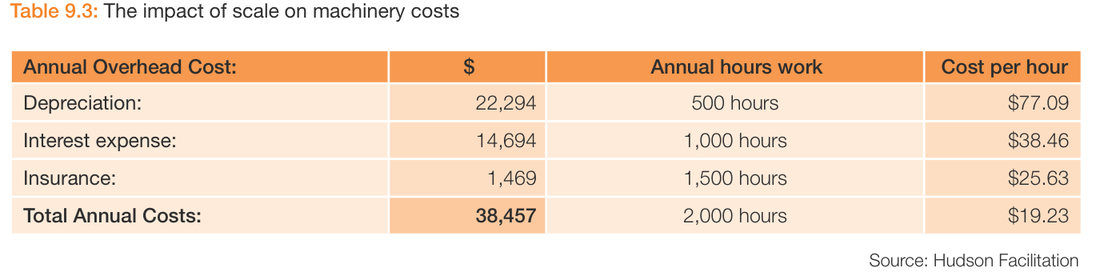
The manual’s worked example runs on a 225 horsepower tractor valued at $202,674, costing the farmer $111,470 after trade-in and financed at 10 per cent over a five year working life. Note that its 10 per cent is higher than the 7 per cent used above, which is a reminder that the cost of capital is an assumption rather than a fact. Its conclusion is worth keeping in mind while you read your own numbers: a farmer whose cropping program needs only 500 hours of tractor work is at a distinct disadvantage to one getting 2,000 hours out of the same machine.
Compared with what a contractor charges
The useful thing about harvest is that there is a published industry benchmark to test your number against. Australian Custom Harvesters publishes a rate guide, and the 2026 edition, valid as at 1 February 2026, lists header rates per engine hour excluding GST with fuel supplied by the grower.
| Machine | Benchmark rate per engine hour (ex GST, grower supplies fuel) |
|---|---|
| Class 6 header | $680 |
| Class 7 header | $780 |
| Class 8 header | $850 |
| Class 9 header | $950 |
| Tractor (minimum 250 hp) and 20 t chaser bin | $300 |
Treat these as suggested benchmarks rather than quotes. Real invoices commonly add float and travel, minimum hour charges and levies, and vary with crop condition and paddock size, all of which push the effective rate up and therefore make owning look relatively better.
To compare like with like you have to take fuel out of your own number, because the grower supplies it under those rates. Doing that leaves ownership plus oil, repairs and labour, which is $105.73 an hour on top of the ownership cost.
The crossover
On a fuel-excluded basis this $900,000 machine costs about $1,007 per engine hour at 150 hours and about $376 per engine hour at 500 hours. Against the Class 8 benchmark of $850, that puts the crossover at roughly 181 engine hours a year.
That number is sensitive to the purchase price, so treat it as a range rather than a threshold: about 151 hours on a $750,000 machine, 181 on a $900,000 machine and 202 on a $1 million machine. Below the crossover a contractor is cheaper. Above it, owning is cheaper per hour.
It is worth understanding why a contractor charges more than twice what the machine appears to cost you at 500 hours, because the gap is not profiteering. Their rate has to carry their own overheads and margin, travel between clients, downtime risk, and the fact that they are running a machine hard for a short season. It also reflects that a contractor billing engine hours bills for paddock-to-paddock moves, set-up and idling on your job, whereas the fuel burn and repair figures above are productive-work assumptions. You will be invoiced for more engine hours than a pure work-rate calculation implies.
Cost per hour is not the whole decision either. A contractor arrives when they arrive, and in a season where the whole district is ready in the same fortnight, owning your own machine buys a harvest window you cannot otherwise buy. That timeliness is worth real money in a year when rain is coming. It is simply not worth an unlimited amount, and the gap between the two columns above is what you are implicitly paying for it.
The machinery investment ratio as a sanity check
Any single machine can be justified. The fleet is harder to argue with, and there is a national benchmark for it. GRDC research carried out with Kondinin Group and a group of farm business consultants, published in 2022 and drawing on a survey of more than 450 growers, put the average machinery investment ratio at about 0.34: total plant, labour, maintenance and contracting costs divided by gross farm income.
Read that definition carefully, because the shorthand misleads. It is 34 cents of plant, labour, maintenance and contracting cost for every dollar of income, not 34 cents of machinery. Labour and contracting are a large part of it, so benchmarking your machinery spend alone against 0.34 will tell you that you are dramatically under-invested when you are not.
Businesses under 0.34 are typically the more efficient ones, with regional variation worth knowing before you judge yourself against the national figure: the western region averaged about 0.32, the northern region about 0.35 and the southern region about 0.38. It is a blunt instrument and it will not tell you which machine to sell. What it will tell you is whether the question is worth asking at all.
Replacement timing
The replacement question has the same shape. Early in a machine’s life, depreciation is the dominant cost and it falls steeply in dollar terms as the machine ages. Later, repairs and downtime start climbing. Add the two together and the curve has a low point, and that low point is your economic replacement window.
It is specific to your hours. A header doing 150 hours a year reaches that point far later in calendar years than the same header doing 500. Which means the standard advice about replacing on a fixed cycle is giving the same answer to two businesses with genuinely different arithmetic.
Putting your own numbers in
Everything above is a template. The values that matter most are your purchase price, your realistic resale, and above all your genuine engine hours, which are usually lower than people estimate. Pull the hours off the machine rather than guessing, and use the engine hour meter rather than the separator or rotor meter, because engine hours are the basis the contract rates are quoted on. They are not the same number, and on a header the gap between them is large.
Once the cost per hour is real, it flows into everything else. It belongs in your crop gross margins, because machinery is usually the largest cost line after land and the first place a plan quietly goes wrong. Testing a replacement or an own-versus-hire decision as a scenario shows what it does to the cash position rather than just to the profit line, and cash flow planning is where a large machinery payment actually bites.
Related reading: our guides to knowing your cost of production, benchmarking your farm business and managing farm input costs.
Assumptions behind the worked example
Checked as at 22 September 2026. All figures exclude GST, on the basis that a GST-registered farm business claims the input tax credit. Class 8 header and front at $900,000 new, five year ownership, 55 per cent resale held constant across all hour levels, 7 per cent cost of capital, insurance and shedding at 0.6 per cent of purchase price, fuel use of 55 litres per hour, diesel at the national average retail price of 273.6 cents per litre including GST for the week ending 20 September 2026 (Australian Institute of Petroleum), less GST and less the off-road fuel tax credit of 53.7 cents per litre applying from 3 August 2026, repairs averaged at $50 per hour over five years, and an operator at $45 per hour.
Contract benchmarks are from the Australian Custom Harvesters guide valid as at 1 February 2026, excluding GST, with fuel supplied by the grower, and are suggested rates rather than quotes. Every one of these will differ on your farm. This is general information, not financial advice.
The short version
A header does not have a cost per hour. It has an annual ownership cost and an hourly running cost, and the number everybody quotes is just those two divided by a use figure that varies enormously between farms. The same $900,000 machine is a $483 an hour machine or a $1,565 an hour machine depending entirely on how often you use it.
Work out your real engine hours, put a real rate on the seat, take the GST and the fuel tax credit off the diesel, and compare the result with the published benchmark on the same basis. If you are somewhere below about 180 engine hours a year, the arithmetic is telling you something worth listening to before the next trade.