How to Benchmark Your Farm Business: The Numbers That Actually Matter

Why Benchmarking Matters More Than You Think
Most farmers have a gut feel for how their business is going. A decent season, reasonable prices, bills are getting paid. But gut feel is a dangerous way to manage a business worth millions of dollars.
Benchmarking is the practice of measuring your farm's financial performance using key metrics and tracking how those numbers change over time. Done well, it tells you whether your business is getting stronger or weaker, which enterprises are pulling their weight, and where the real opportunities for improvement are hiding.
The common assumption is that benchmarking means comparing yourself to other farms. But as the GRDC's Farming the Business manual points out, the most valuable comparison is against your own business over time. Your rainfall, soil type, enterprise mix, and debt position are unique. Comparing your profit per hectare against a farm 500 kilometres away with different soil and rainfall is interesting, but tracking your own profit per hectare over five years tells you something far more useful.
The 6 Financial Ratios Every Farm Business Should Track
Banks use financial ratios to assess your business. You should be using them too, not just before a loan application, but as an ongoing health check. Here are the six that matter most.
1. Equity Ratio (Wealth)
What it measures: how much of the business you actually own versus how much the bank owns. Calculated as total equity divided by total assets.
An equity ratio above 80% is considered strong for most farming businesses. Between 60-80% is acceptable but worth watching. Below 60% means debt is high relative to assets, and any downturn in land values or commodity prices could put pressure on your position.
This is the ratio banks look at first. If your equity ratio is trending down over several years, that is a signal to address before it becomes a problem.
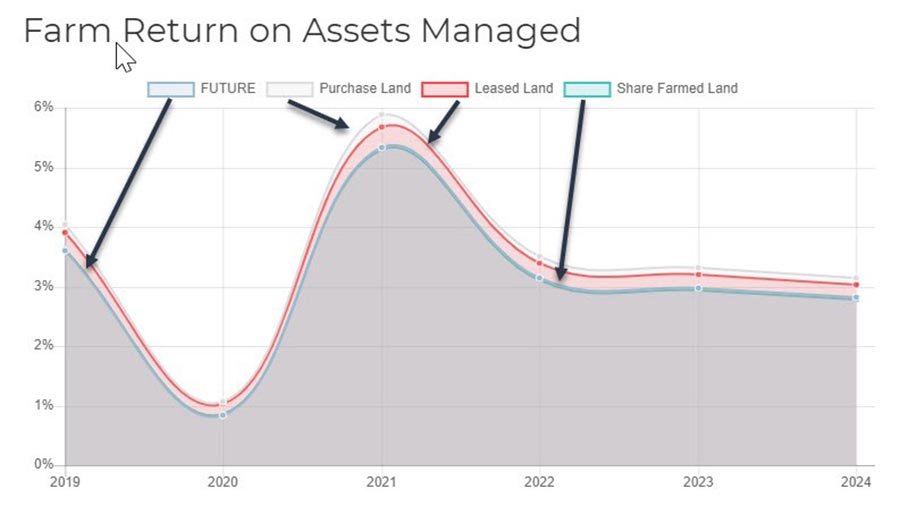
2. Return on Assets Managed (Efficiency)
What it measures: how effectively your farm generates profit from the assets it controls. Calculated as operating profit divided by total assets managed, expressed as a percentage.
This is arguably the most important ratio for measuring true business performance. Research from Pinion Advisory shows that Australia's top 20% of grain farms consistently achieve return on assets managed above 5%, while the bottom 20% often sit below 2%. That gap compounds dramatically over a decade.
3. Operating Profit Margin
What it measures: what percentage of every dollar of revenue you keep as profit after all operating expenses. Calculated as operating profit divided by gross farm revenue.
An operating profit margin of 25-30% is solid for most broadacre operations. Below 15% means costs are eating too deeply into revenue, and any price or yield shock could push the business into loss. Tracking this over five years reveals whether your cost control is improving or deteriorating.
4. Debt Servicing Ratio (Liquidity)
What it measures: your ability to meet interest and principal repayments from operating income. Calculated as total debt servicing costs divided by gross farm income.
This is the ratio that keeps bankers up at night. If debt servicing consumes more than 20-25% of gross income, the business has limited capacity to absorb a poor season. Many farm failures during drought are not caused by low production alone, but by debt servicing obligations that cannot flex when income drops.
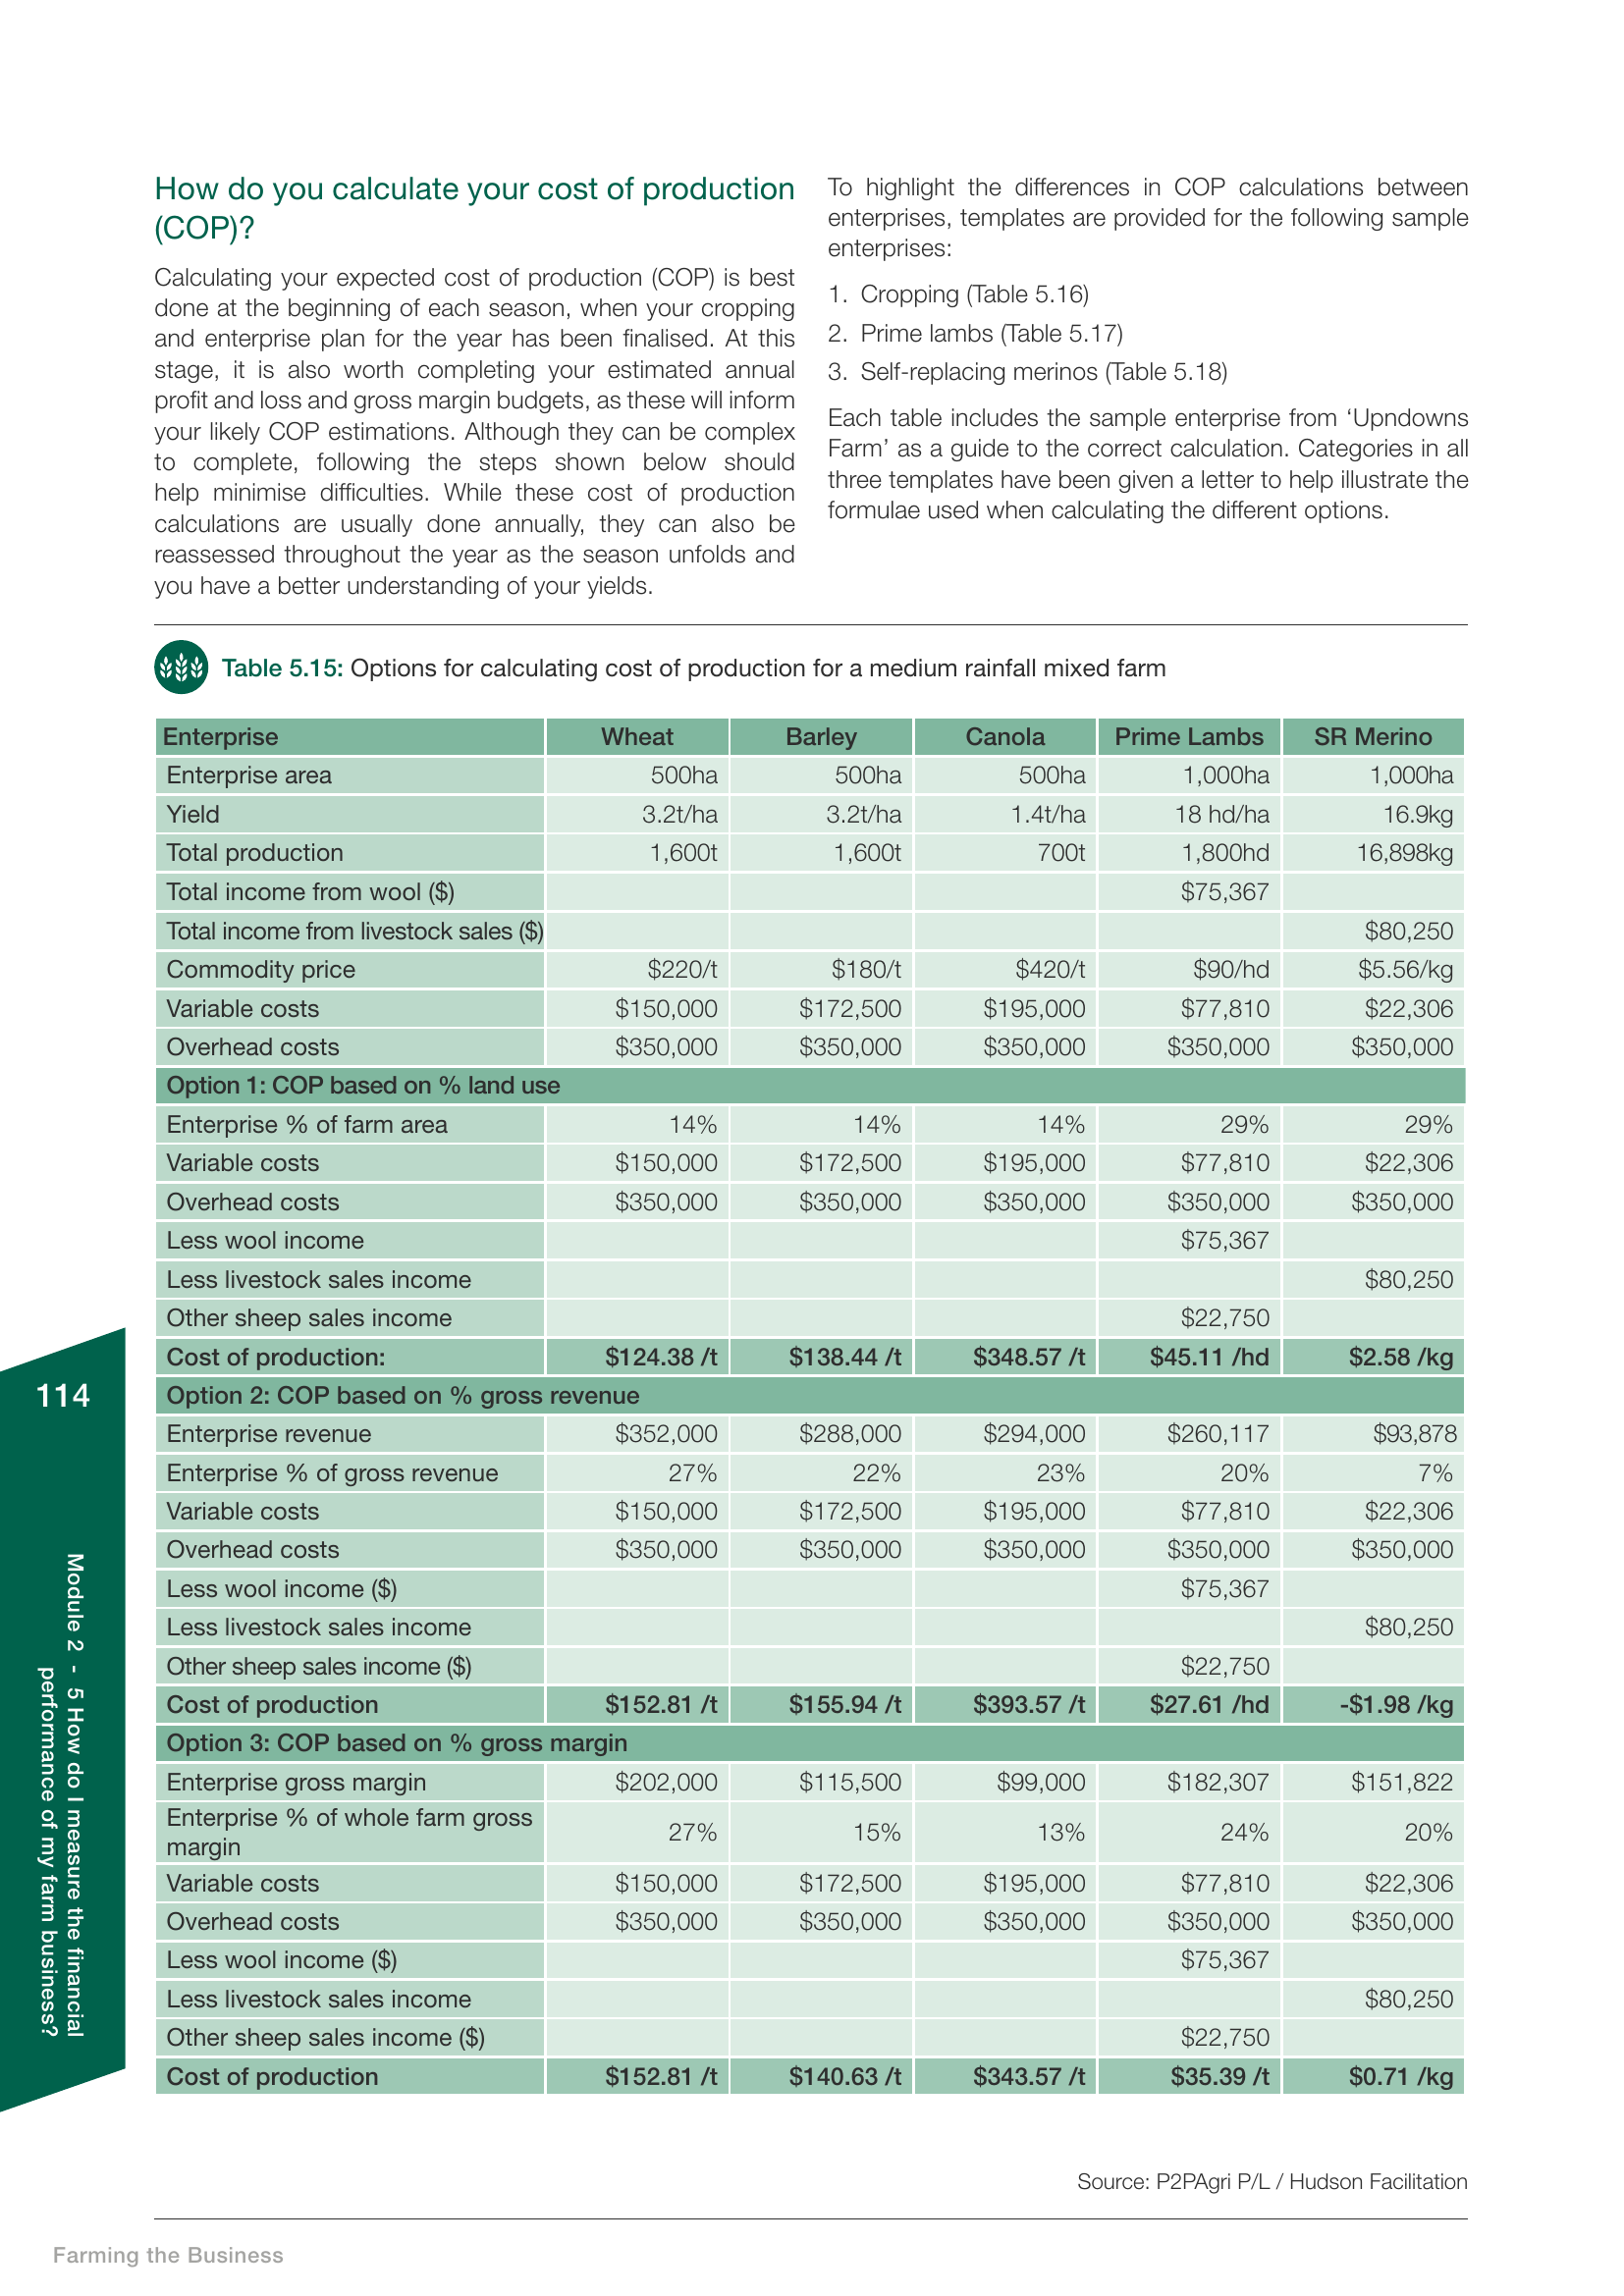
5. Cost of Production Per Tonne (or Per DSE)
What it measures: what it costs you to produce each unit of output. For grain growers, this is cost per tonne. For livestock, cost per DSE or cost per kilogram of meat produced.
As outlined in our guide to cost of production analysis, Australian farmers are price takers. You cannot control what the market pays for your wheat, but you can know exactly what it costs you to produce it. When you know your cost of production, every marketing decision becomes clearer: you know your break-even price and can sell with confidence above it.
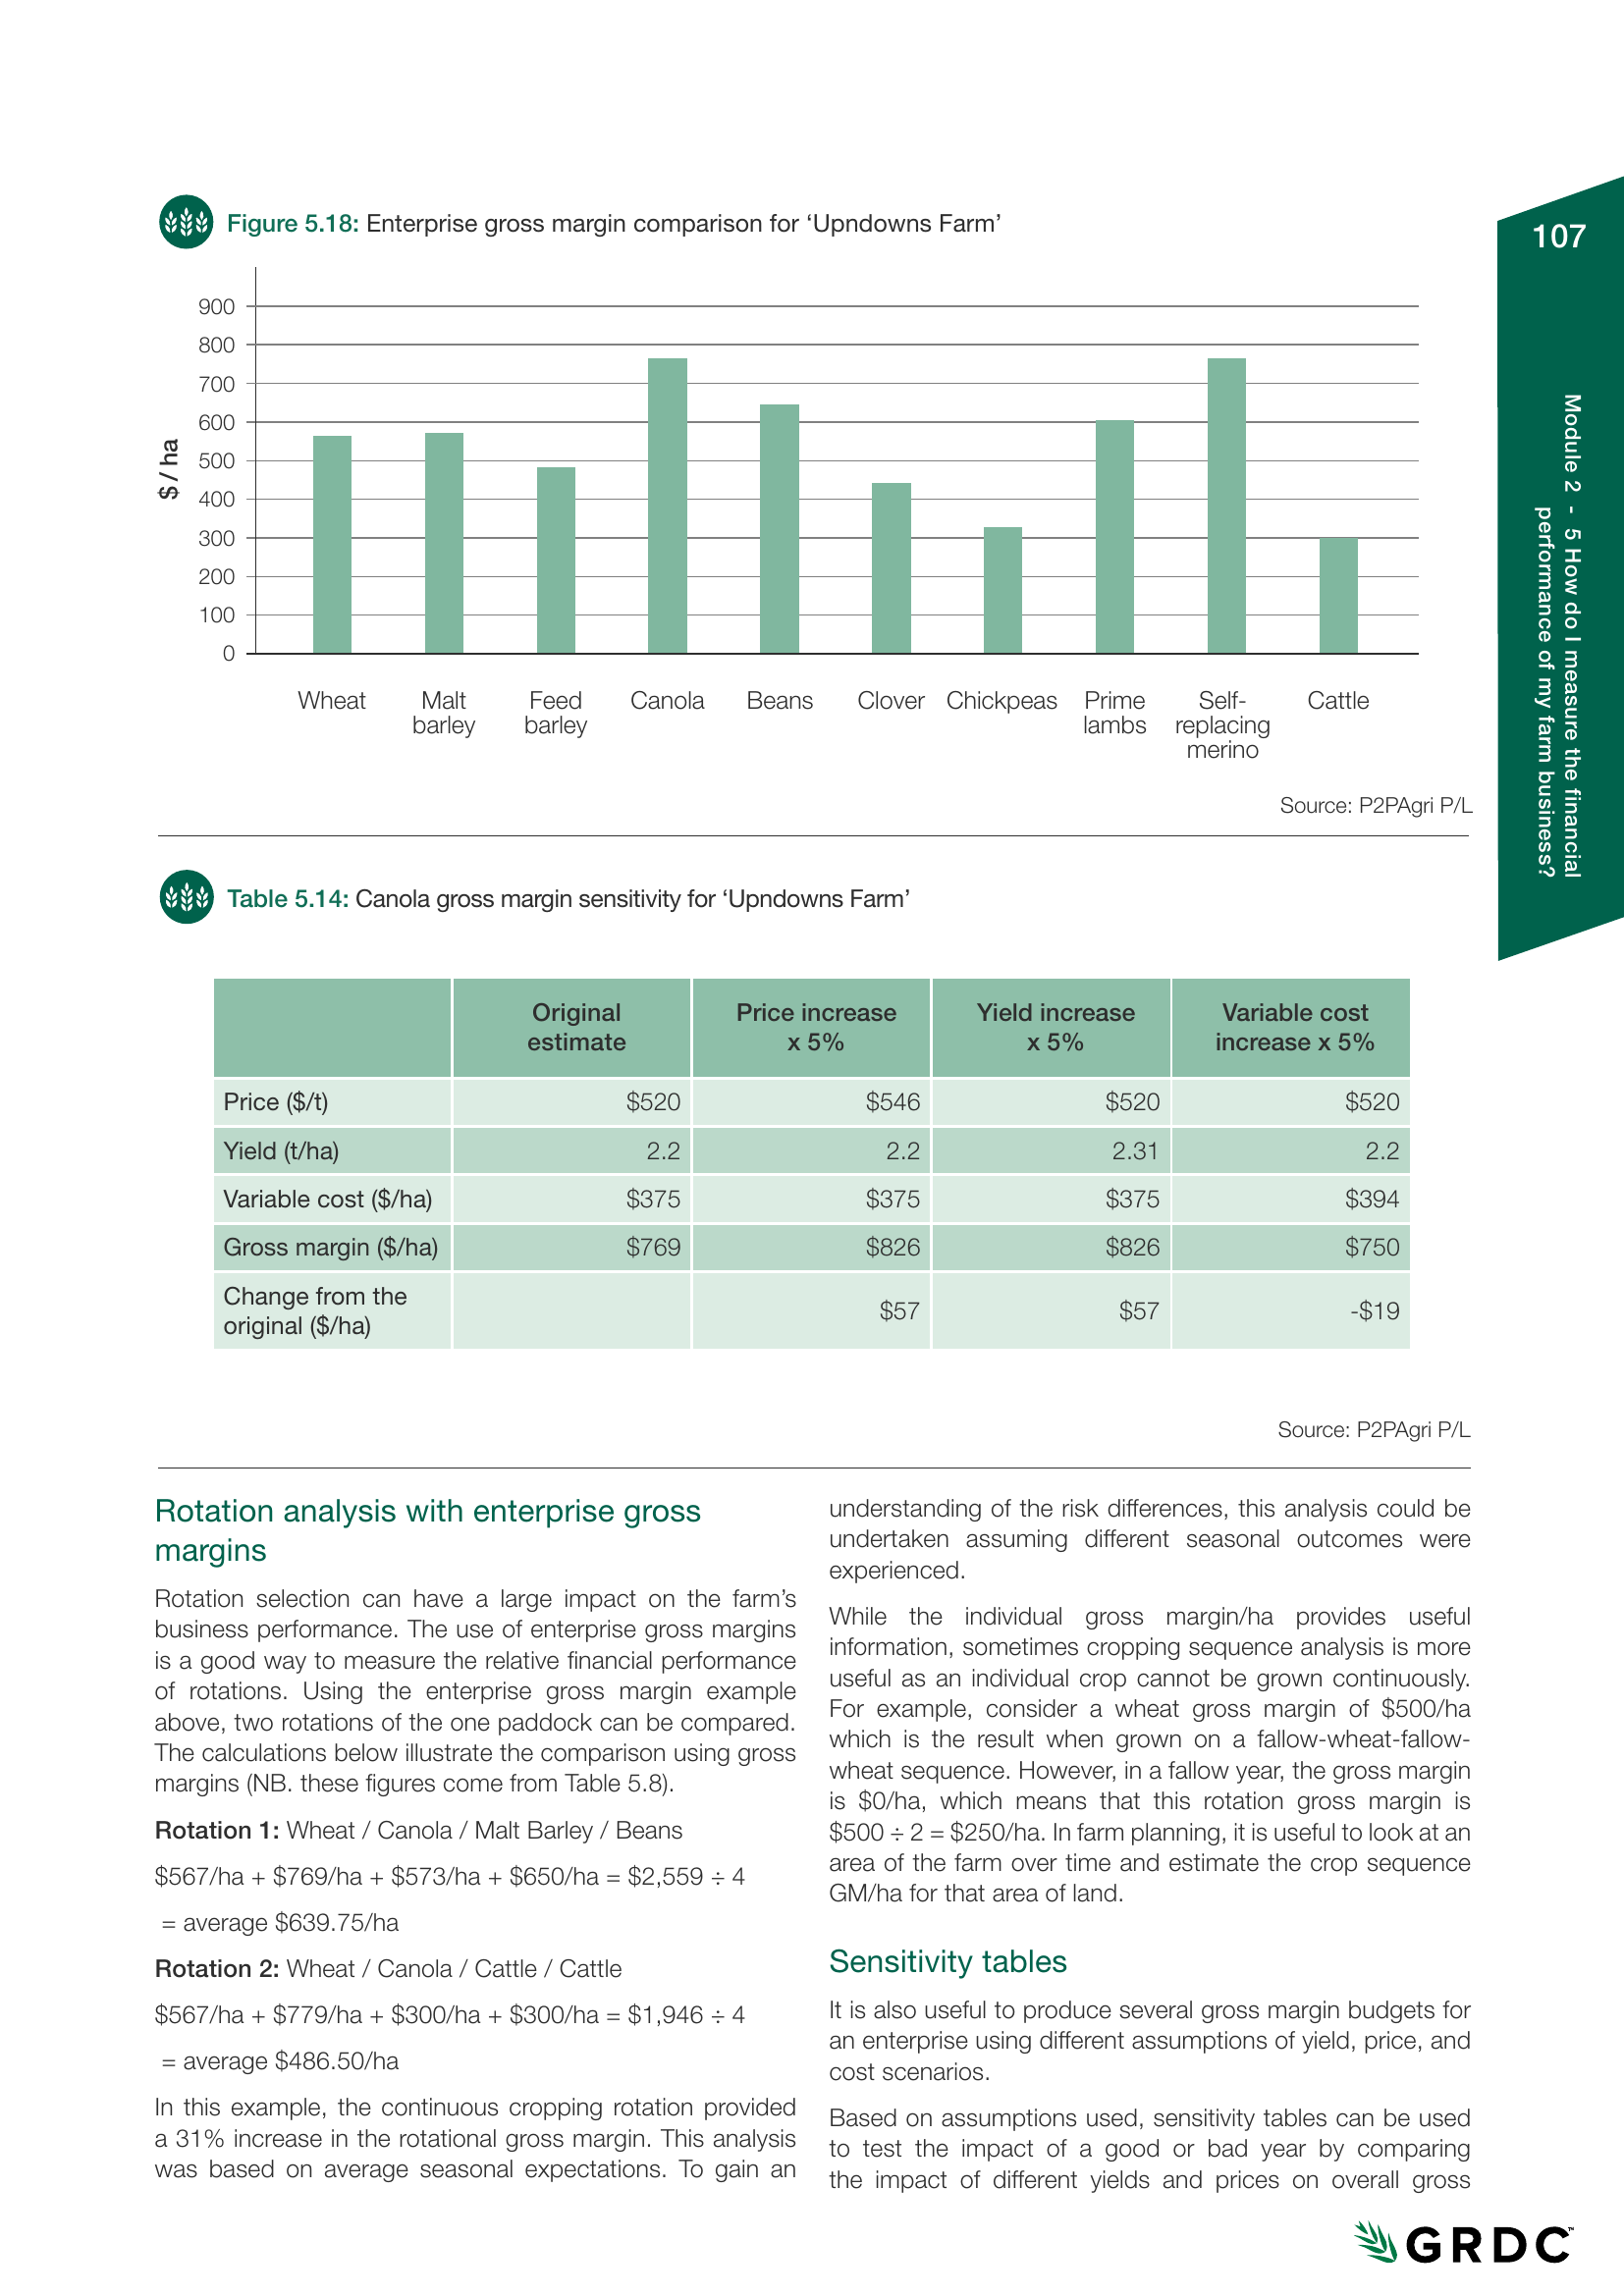
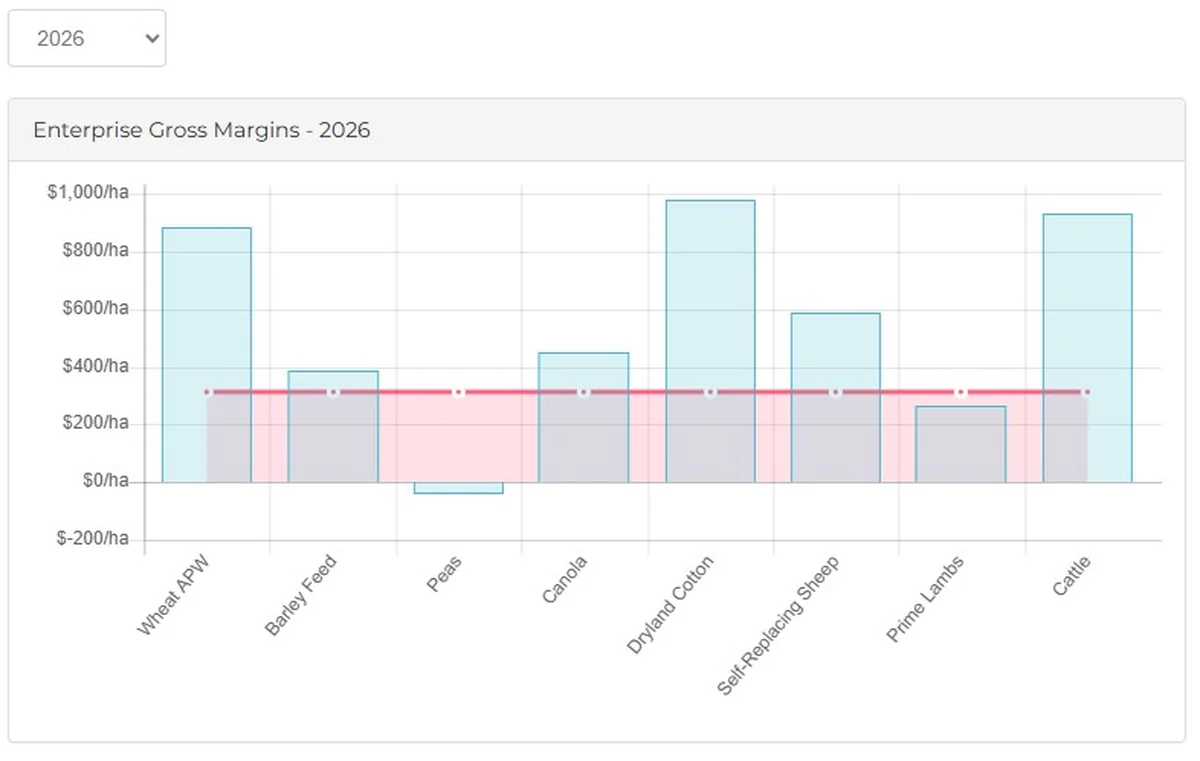
6. Gross Margin Per Hectare (By Enterprise)
What it measures: the gross income from each enterprise less its direct variable costs, expressed per hectare. This is how you compare the relative profitability of wheat versus canola versus lentils versus livestock on your farm.
Gross margin analysis is the foundation of enterprise decision-making. Many farmers are surprised when they calculate it properly. The enterprise you think is your most profitable may not be, once all variable costs are allocated correctly. As covered in P2PAgri's Crop Gross Margin and Livestock Management tools, understanding these numbers is essential for optimising your enterprise mix.
How to Use Your P2PAgri Dashboard for Benchmarking
If you are already using P2PAgri, you have most of these benchmarking tools built into your dashboard. Here is where to find them and how to read them.
Bank Ratio Dials
P2PAgri's Essentials dashboard displays your key bank ratios as visual dials with colour coding: green for healthy, amber for watch, and red for action needed. These update automatically when you sync your accounting data from Xero or MYOB.
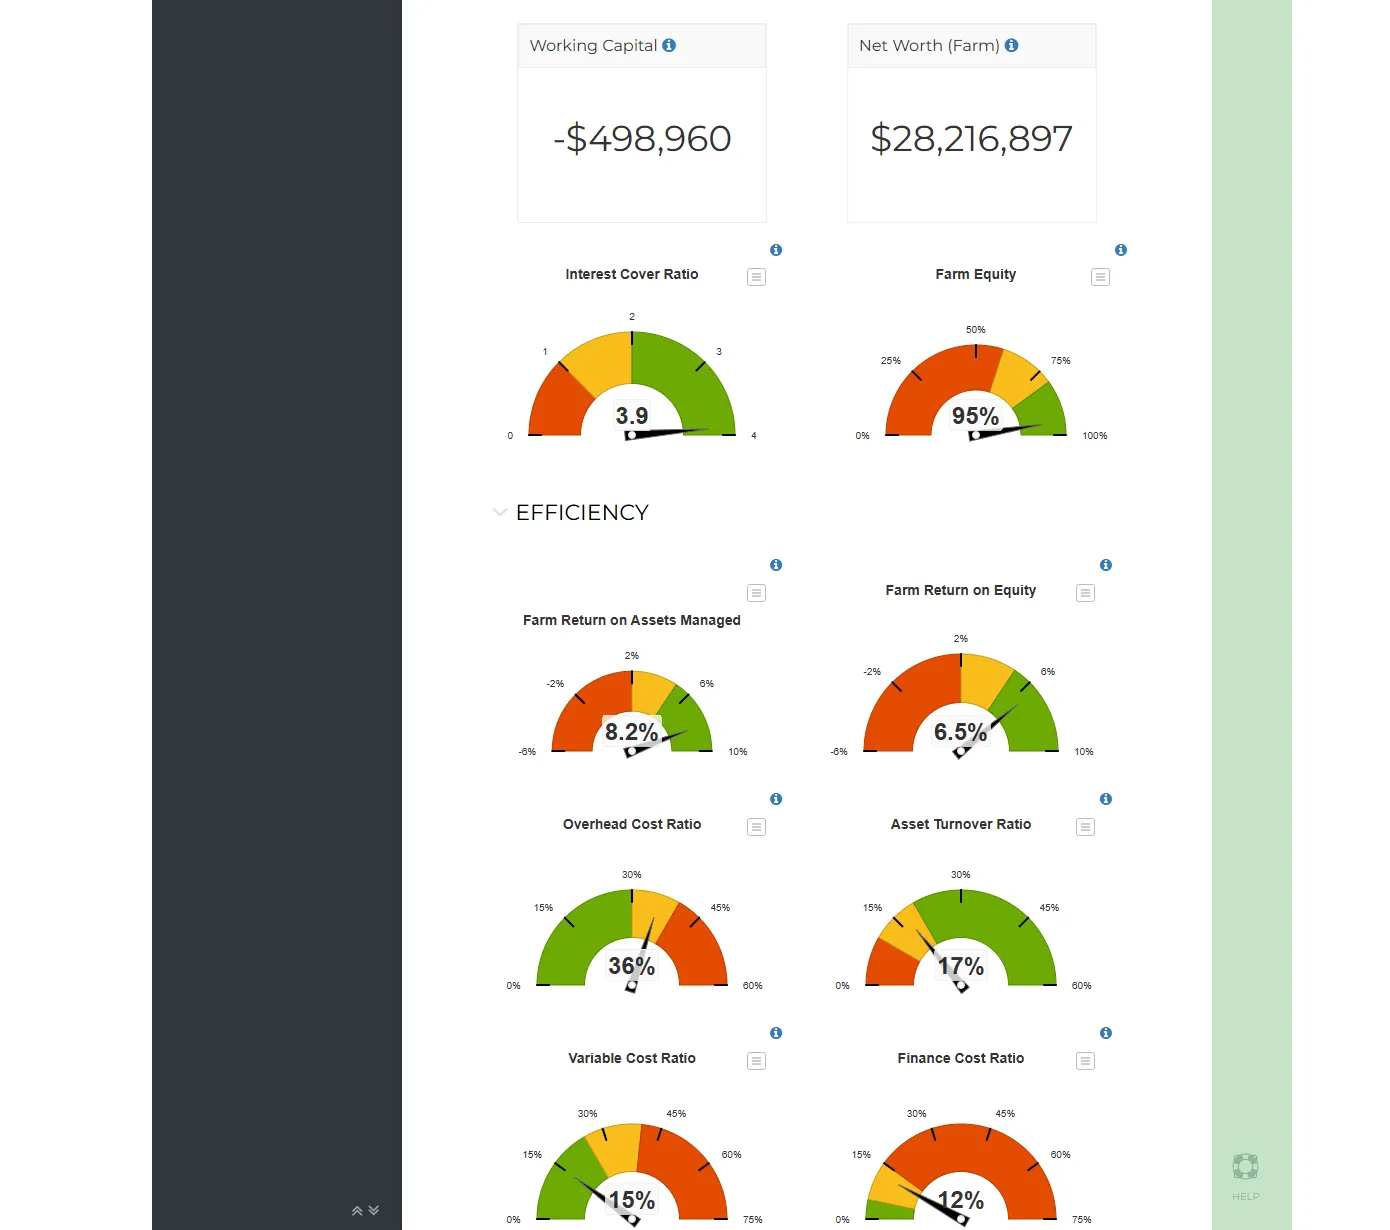
The power of these dials is not in any single reading. It is in the trend. Check them after each Xero sync and note the direction. An equity ratio that has moved from 82% to 78% to 74% over three years is telling you something important, even though each individual number looks acceptable.
Efficiency Dashboard
The efficiency dashboard in P2PAgri tracks metrics like return on assets, operating efficiency, and expense ratios with trend charts that show your performance over multiple years. This is your long-term benchmarking view, answering the question: is my business getting better or worse at converting resources into profit?
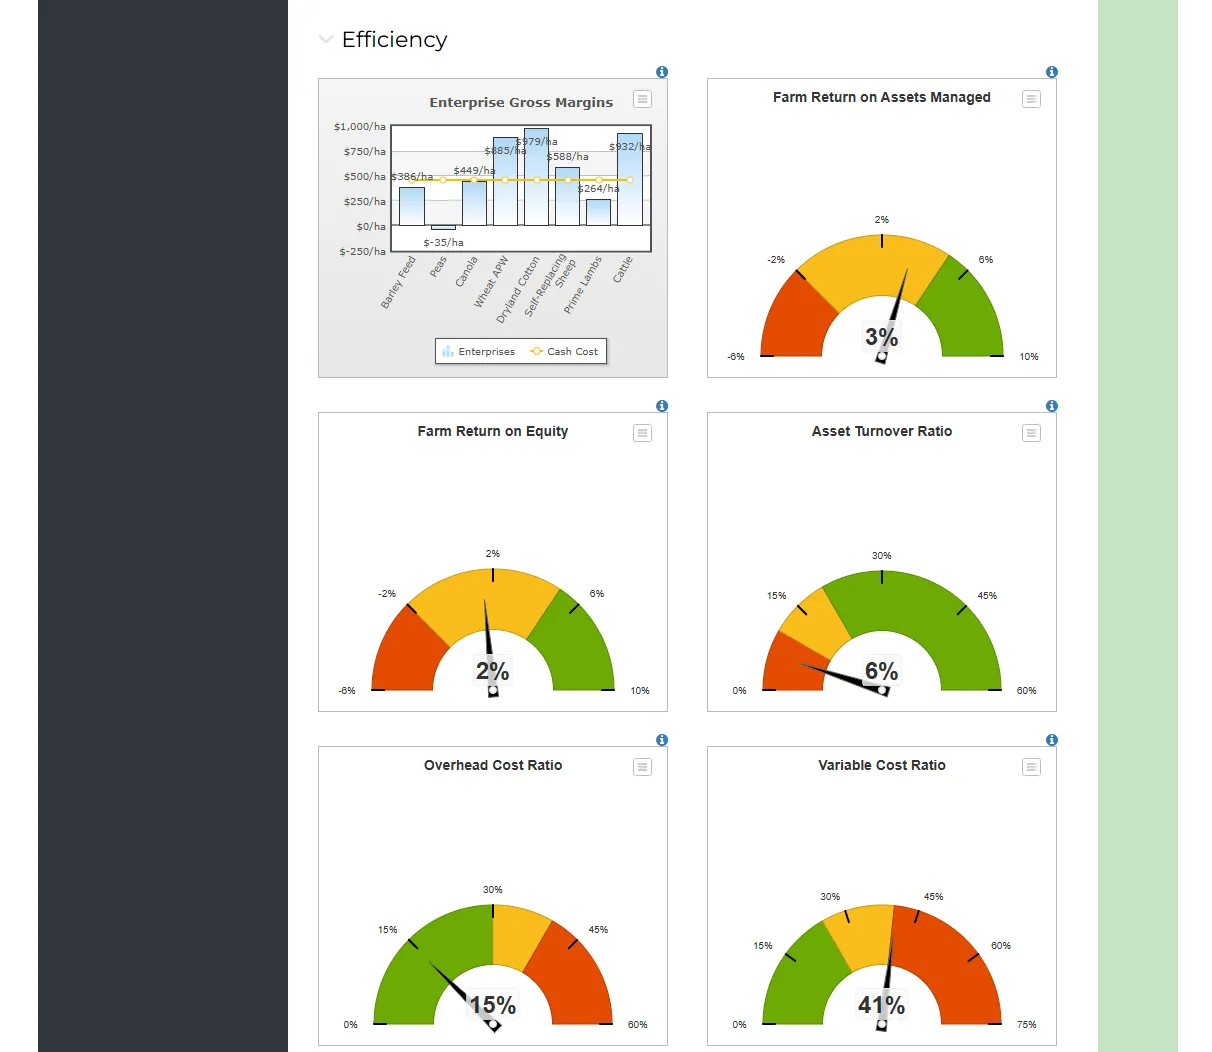
Gross Margin Reports
For enterprise-level benchmarking, P2PAgri's gross margin reports break down revenue and variable costs by crop and livestock enterprise. You can see exactly which paddocks and which enterprises are contributing to profit and which are dragging it down.
The 3-Year Trend Test: A Simple Benchmarking Exercise
If you want a practical starting point, try this exercise. It takes about 30 minutes with P2PAgri and will tell you more about your business direction than any industry average.
Step 1: Pull three years of data. Sync your Xero or MYOB data into P2PAgri to get at least three years of financial history. The free Essentials plan does this.
Step 2: Note these six numbers for each year. Equity ratio, return on assets managed, operating profit margin, debt servicing ratio, cost of production for your main crop, and gross margin per hectare for your top two enterprises.
Step 3: Look for the trend, not the number. Which ratios are improving? Which are declining? Are your costs of production going up faster than your prices? Is your equity growing or shrinking?
Step 4: Identify the one thing to fix. You do not need to overhaul your entire business. Pick the one ratio that is trending in the wrong direction and focus on understanding why. Is it a cost issue? A yield issue? A pricing issue? A debt structure issue?
This is benchmarking at its most practical. No industry comparison needed. Just your own data, tracked over time, revealing where to focus your management effort.
What About Comparing to Other Farms?
Industry benchmarking data has its place. Organisations like ABARES, Agrista, and state-based groups like Grain Producers SA publish valuable data on farm financial performance by region and enterprise type.
This data is useful for context. If the top 20% of grain farms in your region achieve a return on assets of 5%+ and you are sitting at 2%, that tells you there is room to improve. But it does not tell you how to improve. Only your own detailed numbers can do that.
The danger of industry benchmarking is comparing apples with oranges. Farm size, soil quality, rainfall zone, debt levels, and enterprise mix vary so widely that a single "average" figure can be misleading. A farm generating $750/ha gross margin on high-value land worth $7,000/ha is in a very different position to a farm generating $400/ha on land worth $2,500/ha, even though the second farm may have a better return on assets.
Use industry data to ask the right questions. Use your own data to find the answers.
Preparing for Your Bank Review with Benchmarking Data
One of the most practical applications of benchmarking is preparing for your annual bank review. Banks assess farm loan risk using the same ratios described above. When you walk into that meeting with your own analysis already done, two things happen: you demonstrate that you are managing your business professionally, and you control the narrative rather than reacting to whatever the bank presents.
As our guide to getting the best deal from your bank explains, presenting your Management P&L, Balance Sheet, key bank ratios with trend charts, and scenario analysis showing how your business performs under different conditions is exactly what positions you for better terms.
Tony Hudson from Hudson Facilitation (one of our accredited advisers) used P2PAgri to help a client seeking $1M in additional borrowing. The bank was so impressed with the detailed financial projections that they offered a 0.5% interest rate reduction, saving the client $15,000 per year in interest. That is the kind of result that comes from knowing your numbers inside and out.
Start With What You Have
Benchmarking does not have to be complicated. You do not need expensive consultants or complex software to begin. If you have Xero or MYOB and three years of tax returns, you have enough data to start measuring the metrics that matter.
P2PAgri's free Essentials plan generates your Management P&L, Balance Sheet, key bank ratios with visual dials and trend charts, and performance trend analysis directly from your accounting data. No manual data entry required. It takes about 15 minutes to sync your Xero data and see your first set of benchmarking metrics.
If you want to go deeper with enterprise-level gross margin analysis, cash flow tracking, and cost of production by crop, the Season plan adds those tools. And if you need 5-year projections and scenario analysis to model how different decisions affect your benchmarks going forward, that is what the Future plan was built for.
The important thing is to start measuring. Because the numbers that actually matter are the ones that show you where your business is heading, not just where it has been.
Put This Into Practice
P2PAgri helps you apply these concepts with interactive tools and real-time analysis of your farm data.
Get Started Free