Managing Farm Input Costs When Everything Keeps Rising: A Practical Guide

The Input Cost Problem Every Australian Farmer Faces
Input costs are the number one concern for Australian farmers heading into the 2026 season. According to ABARES, average farm cash costs are expected to rise from $702,000 to as high as $756,000 per farm this year. Combined with softer commodity prices, average broadacre farm profits are forecast to fall by 40% - from $210,000 to $126,000 per farm.
The squeeze is coming from every direction. Urea prices have surged due to ongoing disruptions in the Strait of Hormuz, with on-farm costs reaching around $1,400 per tonne in early 2026 - up from roughly $700 a year earlier. Diesel has pushed past $2.25 per litre in many regional areas. Labour costs continue to climb. Chemical prices remain elevated above pre-2022 levels.
Individually, each of these increases is manageable. Together, they can quietly erode your margin until there is nothing left. The farmers who navigate this best are not the ones who panic - they are the ones who know their numbers and make deliberate, informed decisions about where every dollar goes.
Where the Money Actually Goes: Understanding Your Cost Structure
Before you can manage input costs, you need to understand where they sit within your total cost structure. Many farmers have a gut feel for what things cost, but fewer have a precise breakdown that shows the relative weight of each input.
The GRDC's Farming the Business manual - developed by P2PAgri's Mike Krause for the Grains Research and Development Corporation - classifies farm costs into five categories: variable costs (direct input costs), overhead costs (fixed costs), finance costs, personal costs, and capital costs. Understanding which category each expense falls into is the starting point for managing them effectively.
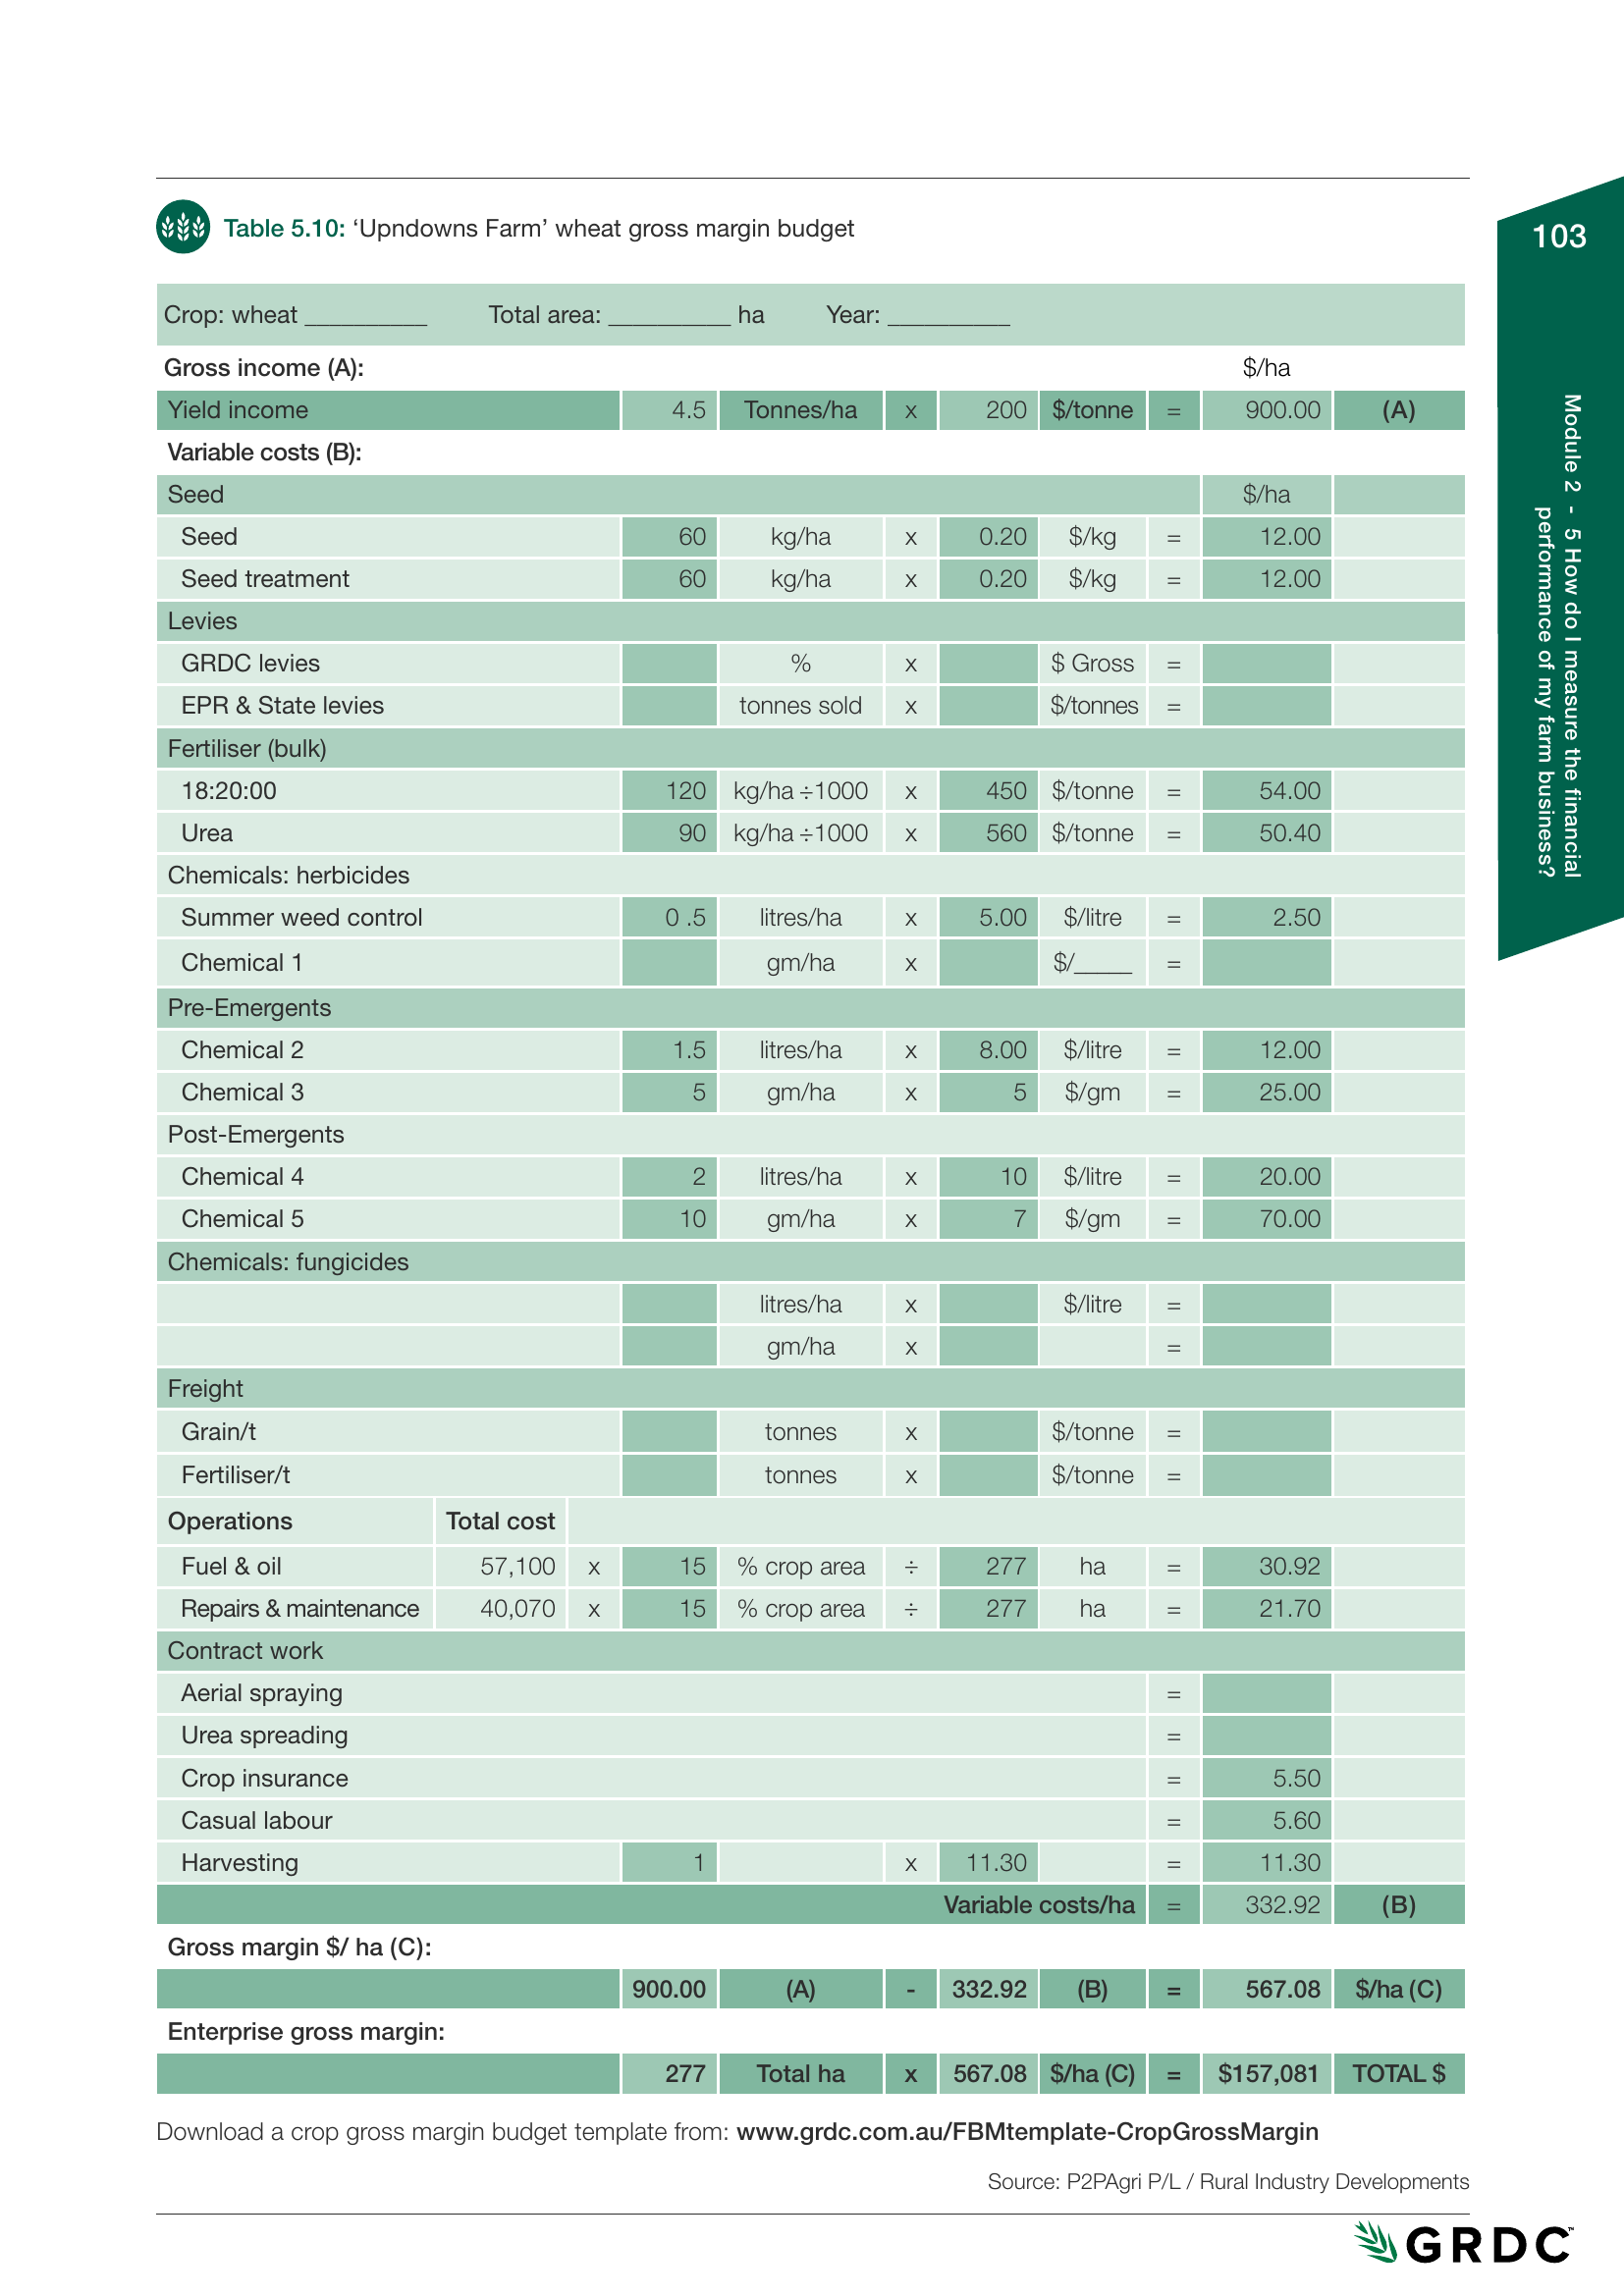
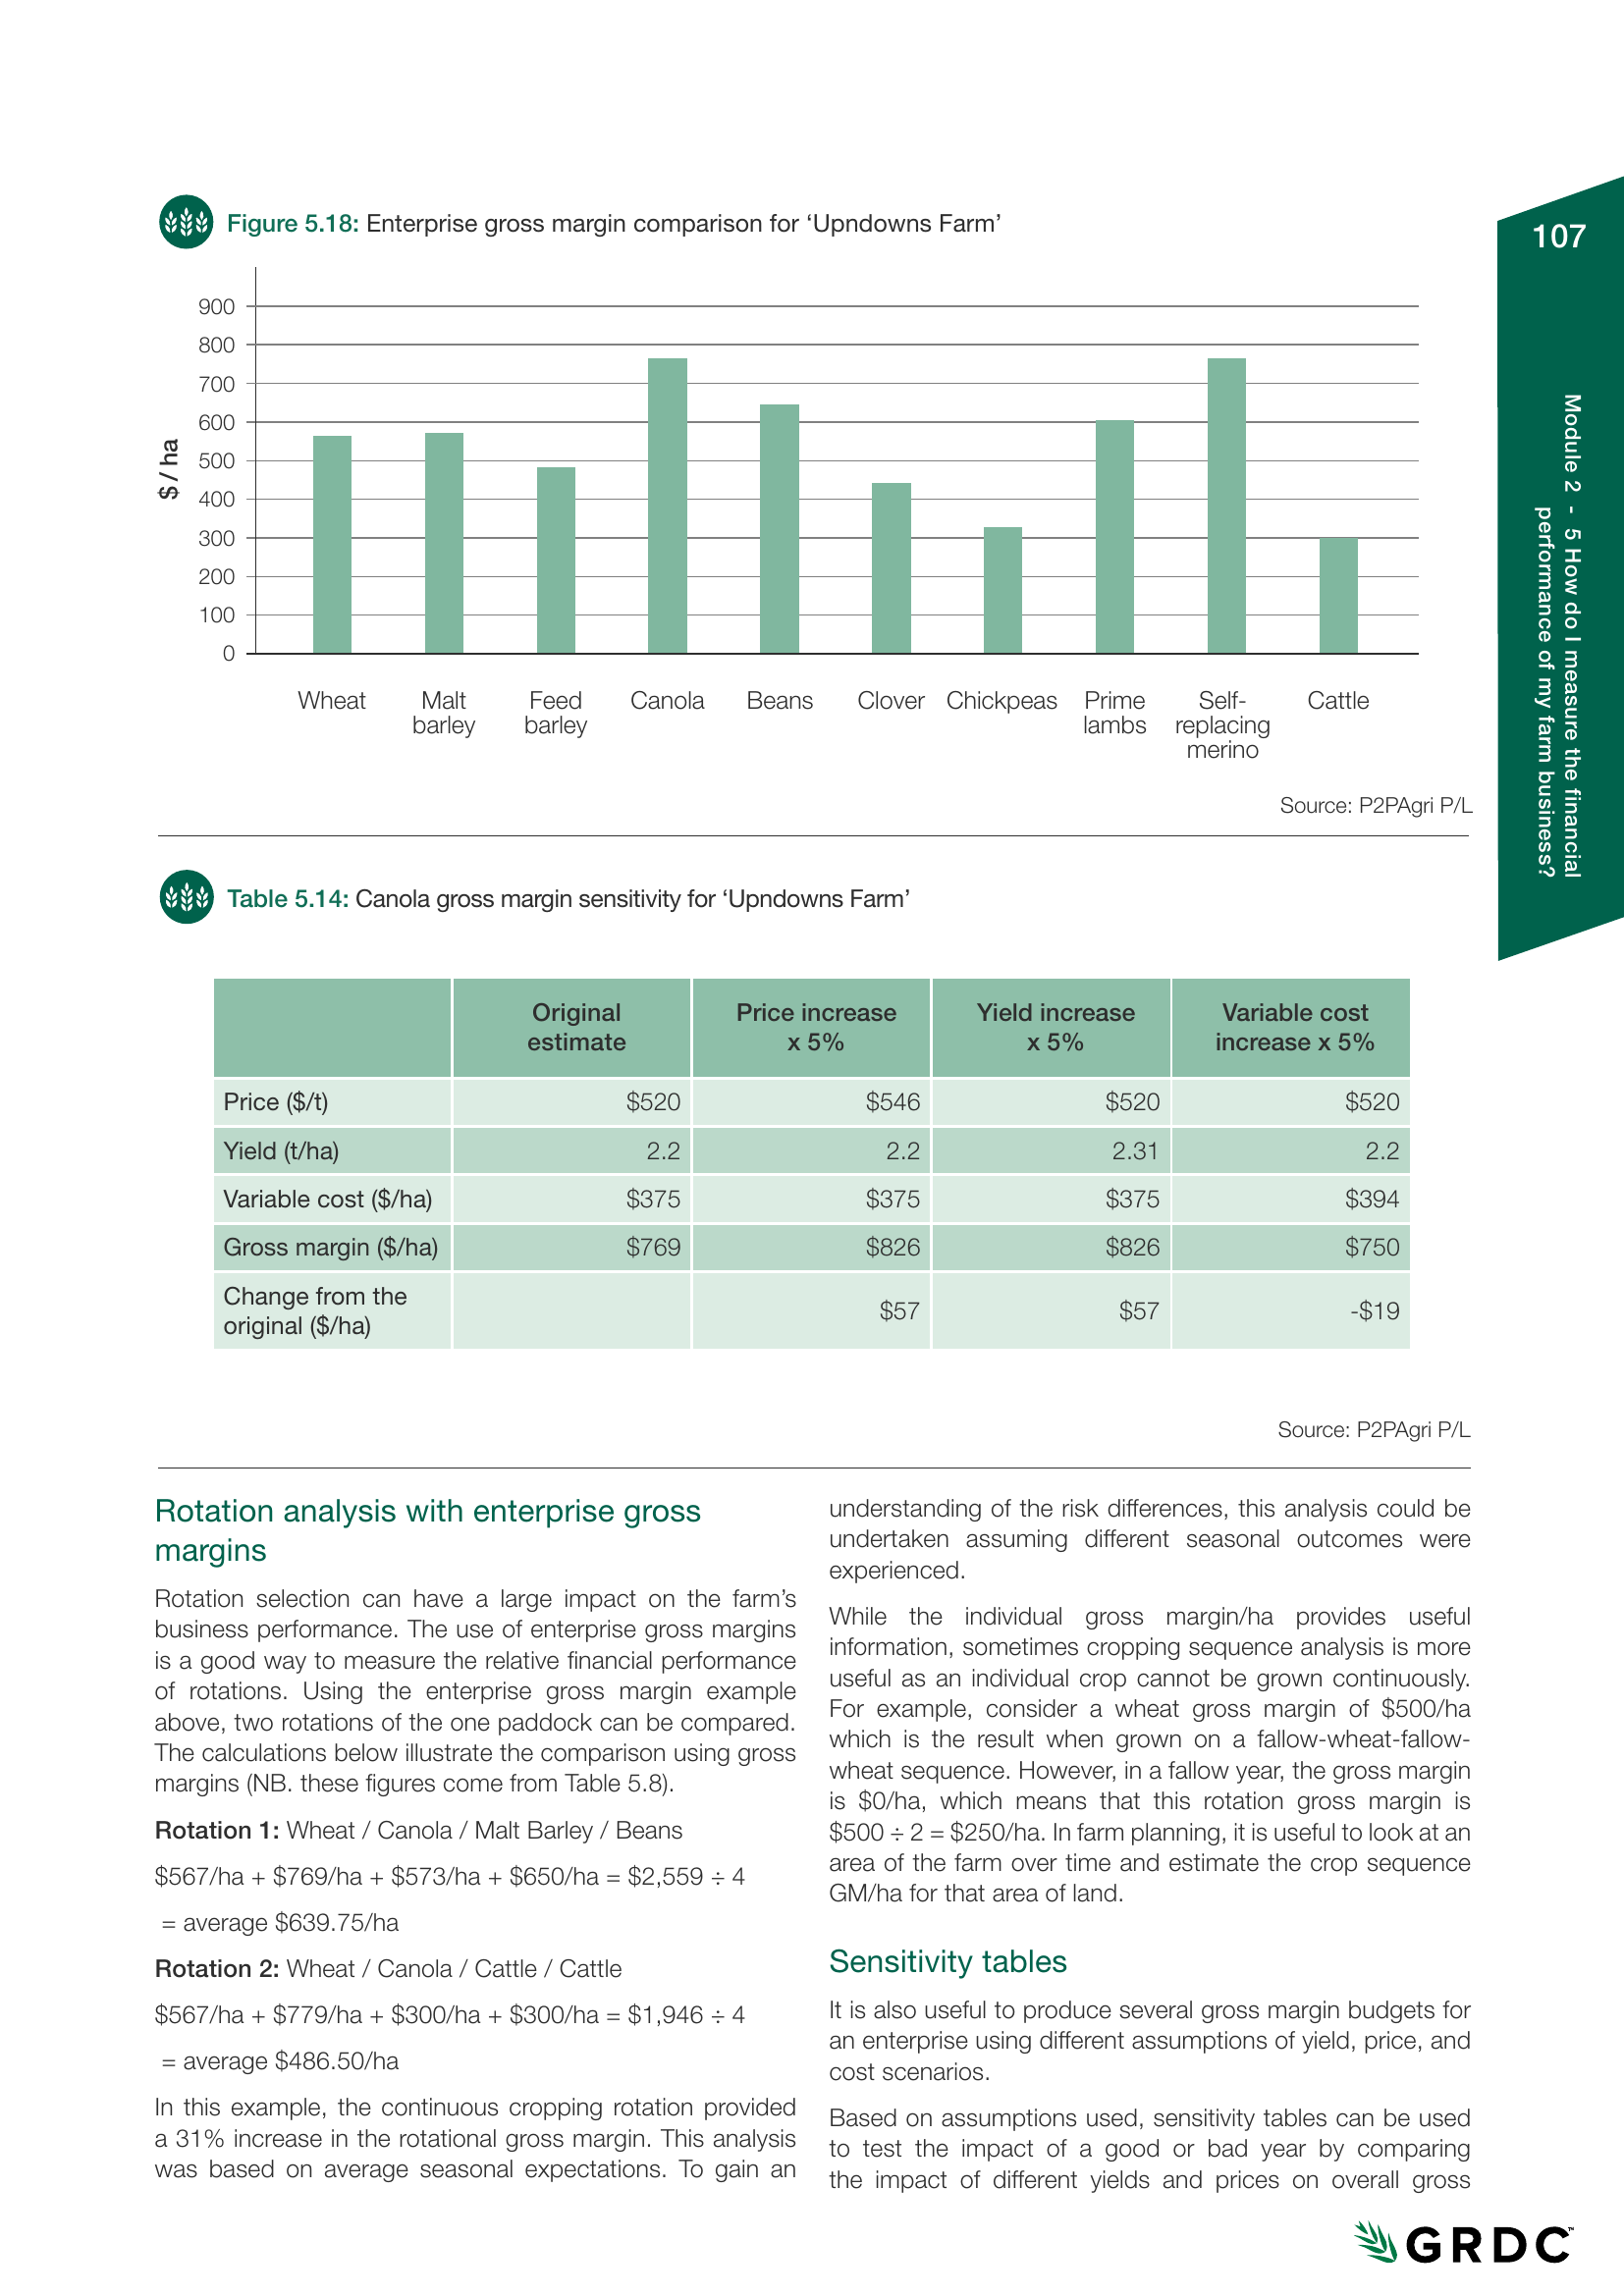
For a typical broadacre cropping operation, the variable cost breakdown per hectare looks something like this: fertiliser is typically the single largest line item at 25-35% of variable costs, followed by chemicals and herbicides at 20-30%. Fuel and oil generally account for 10-15%, with seed, freight, insurance, and casual labour making up the remainder. The wheat gross margin example in Farming the Business (Table 5.10) illustrates this clearly - fertiliser at $104.40/ha and chemicals at $129.50/ha dwarf fuel and oil at $30.92/ha out of total variable costs of $332.92/ha.
For livestock operations, the cost profile is different. Feed costs (including supplementary feeding, hay, and grain), animal health (drenching, marking, veterinary), shearing and crutching, and freight dominate the variable cost picture. The manual walks through detailed calculations for both crop gross margins and livestock gross margins, and being able to do this for your own operation is the foundation of managing input costs well.
The key insight here is that not all cost increases affect your bottom line equally. A 20% rise in fertiliser cost has a far greater dollar impact than a 20% rise in seed cost. Knowing this helps you direct your cost-management energy where it will have the most effect.
The 2026 Input Cost Outlook: What Has Changed and What to Watch
The input cost environment heading into 2026 is a mixed picture, and it is worth understanding what is moving and why.
Fertiliser is the headline story. Australia imports nearly all of its popular fertilisers, and roughly 60% of urea imports travel through the Strait of Hormuz. The ongoing conflict in the Middle East has severely disrupted this supply chain. It previously took about 1.8 to 2 tonnes of wheat to pay for one tonne of urea - that ratio has now doubled to roughly 4, which means the margin for profit has been significantly compressed before the seed even hits the ground. Some growers are reconsidering whether to plant at all given the economics.
Fuel remains volatile. The Hormuz crisis pushed diesel above $2.25/L in many areas, and while strategic reserve releases have eased some supply pressure, regional areas continue to face both higher prices and intermittent availability. As we covered in our Iran fuel crisis analysis, fuel typically ranks around 24th out of 31 factors in a sensitivity analysis of net farm profit - meaningful, but not the margin-destroyer many fear when considered in the context of total costs.
Chemicals have come down from their 2022-23 peaks but remain above historical averages. Glyphosate, the workhorse herbicide for most broadacre operations, is roughly 30-40% cheaper than its 2022 highs but still significantly above pre-2020 levels.
Labour continues to tighten. The agricultural workforce shortage has not eased, and wage growth in rural areas is running ahead of urban centres. For operations that rely on casual or seasonal workers, this is an increasingly significant cost line.
Interest costs are the sleeper. With the average concessional farm loan rate sitting around 5.18% and total farm debt at a record $131.4 billion nationally, debt servicing is consuming a growing share of farm cash flow. This is not technically an "input cost," but it competes directly with input spending for available cash.
The Cost-of-Production Approach: Know Your Break-Even Before Committing
The single most powerful tool for managing input costs is knowing your cost of production (COP) for each enterprise. As our detailed COP guide explains, this tells you the minimum price you need to receive for each tonne of grain, kilogram of wool, or head of livestock to cover your costs.
Farming the Business defines cost of production as the total cost to produce a unit of commodity, including both variable costs and an allocation of overhead costs. The manual outlines three methods for allocating overheads: by percentage of land use, by percentage of gross revenue, or by percentage of total gross margin. Each gives a different result, and the important thing is to pick one method and use it consistently so you can track trends over time.
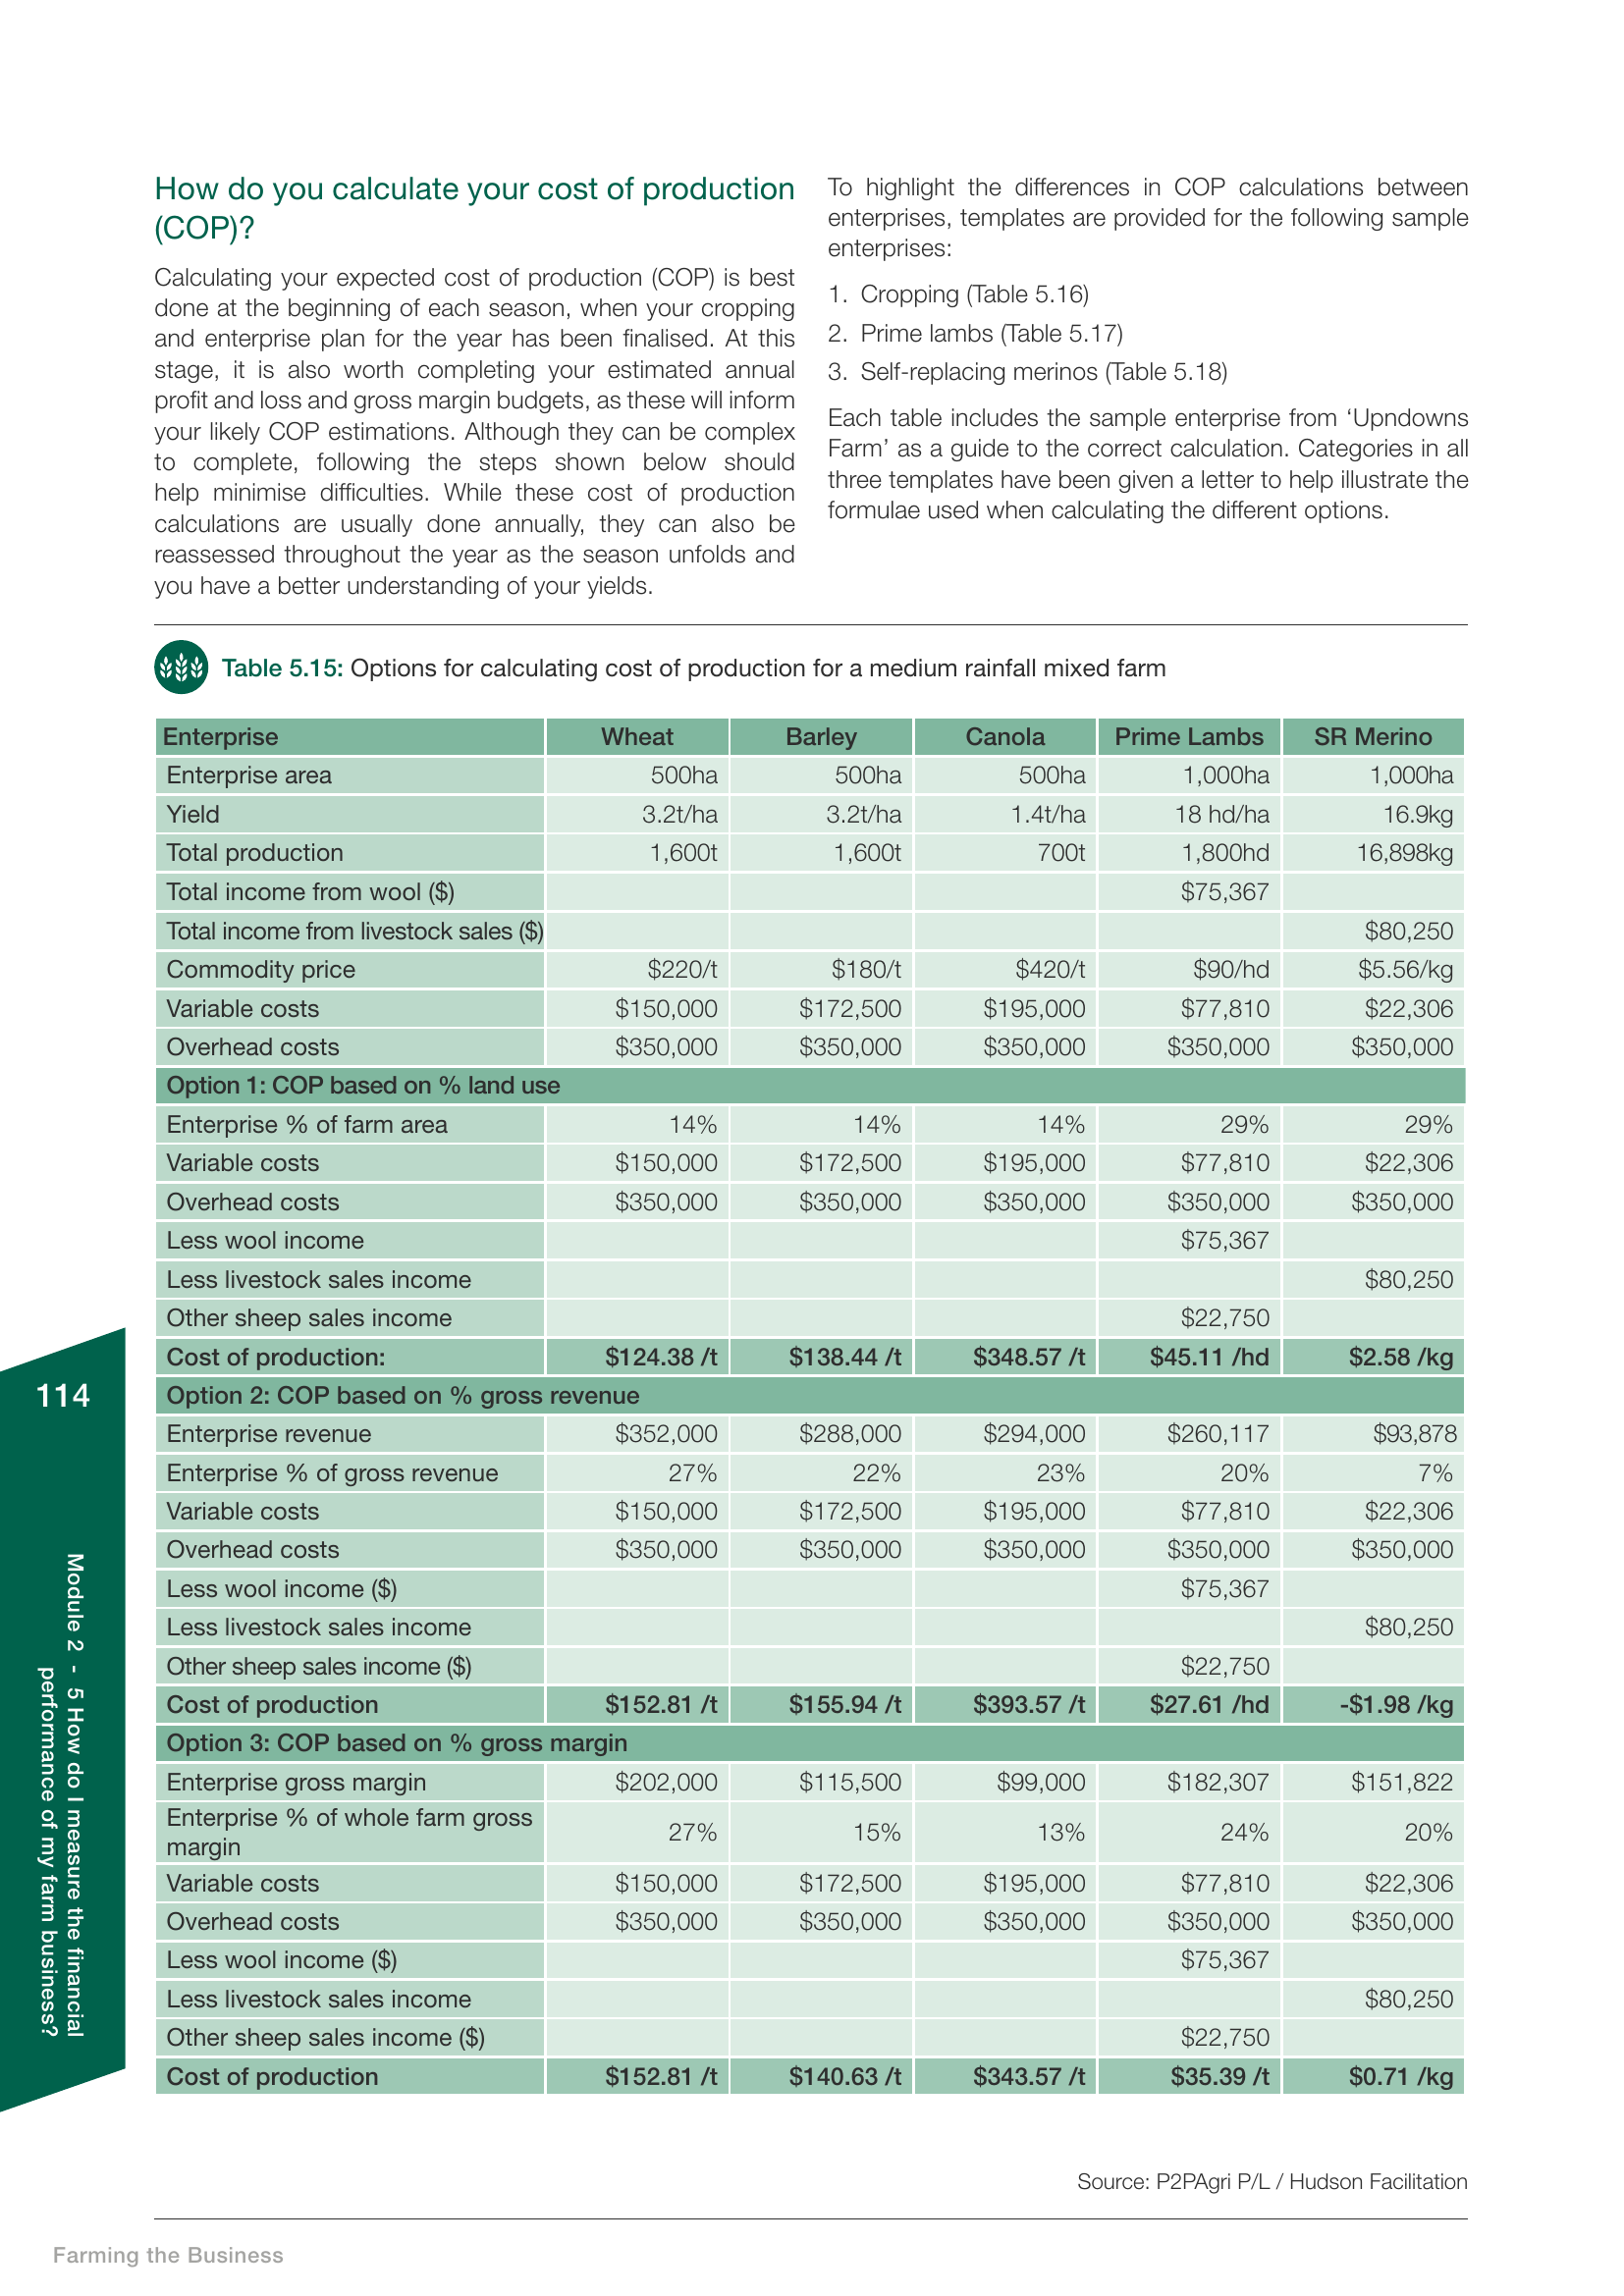
Why does this matter for managing input costs? Because once you know your COP, you can make informed decisions about every input purchase. If your wheat COP is $280/t and current wheat futures are sitting at $320/t, you have a $40/t margin to work with. If urea prices push your COP to $330/t, that margin has evaporated and you need to either adjust your marketing strategy, reduce other costs, or reconsider your planting program.
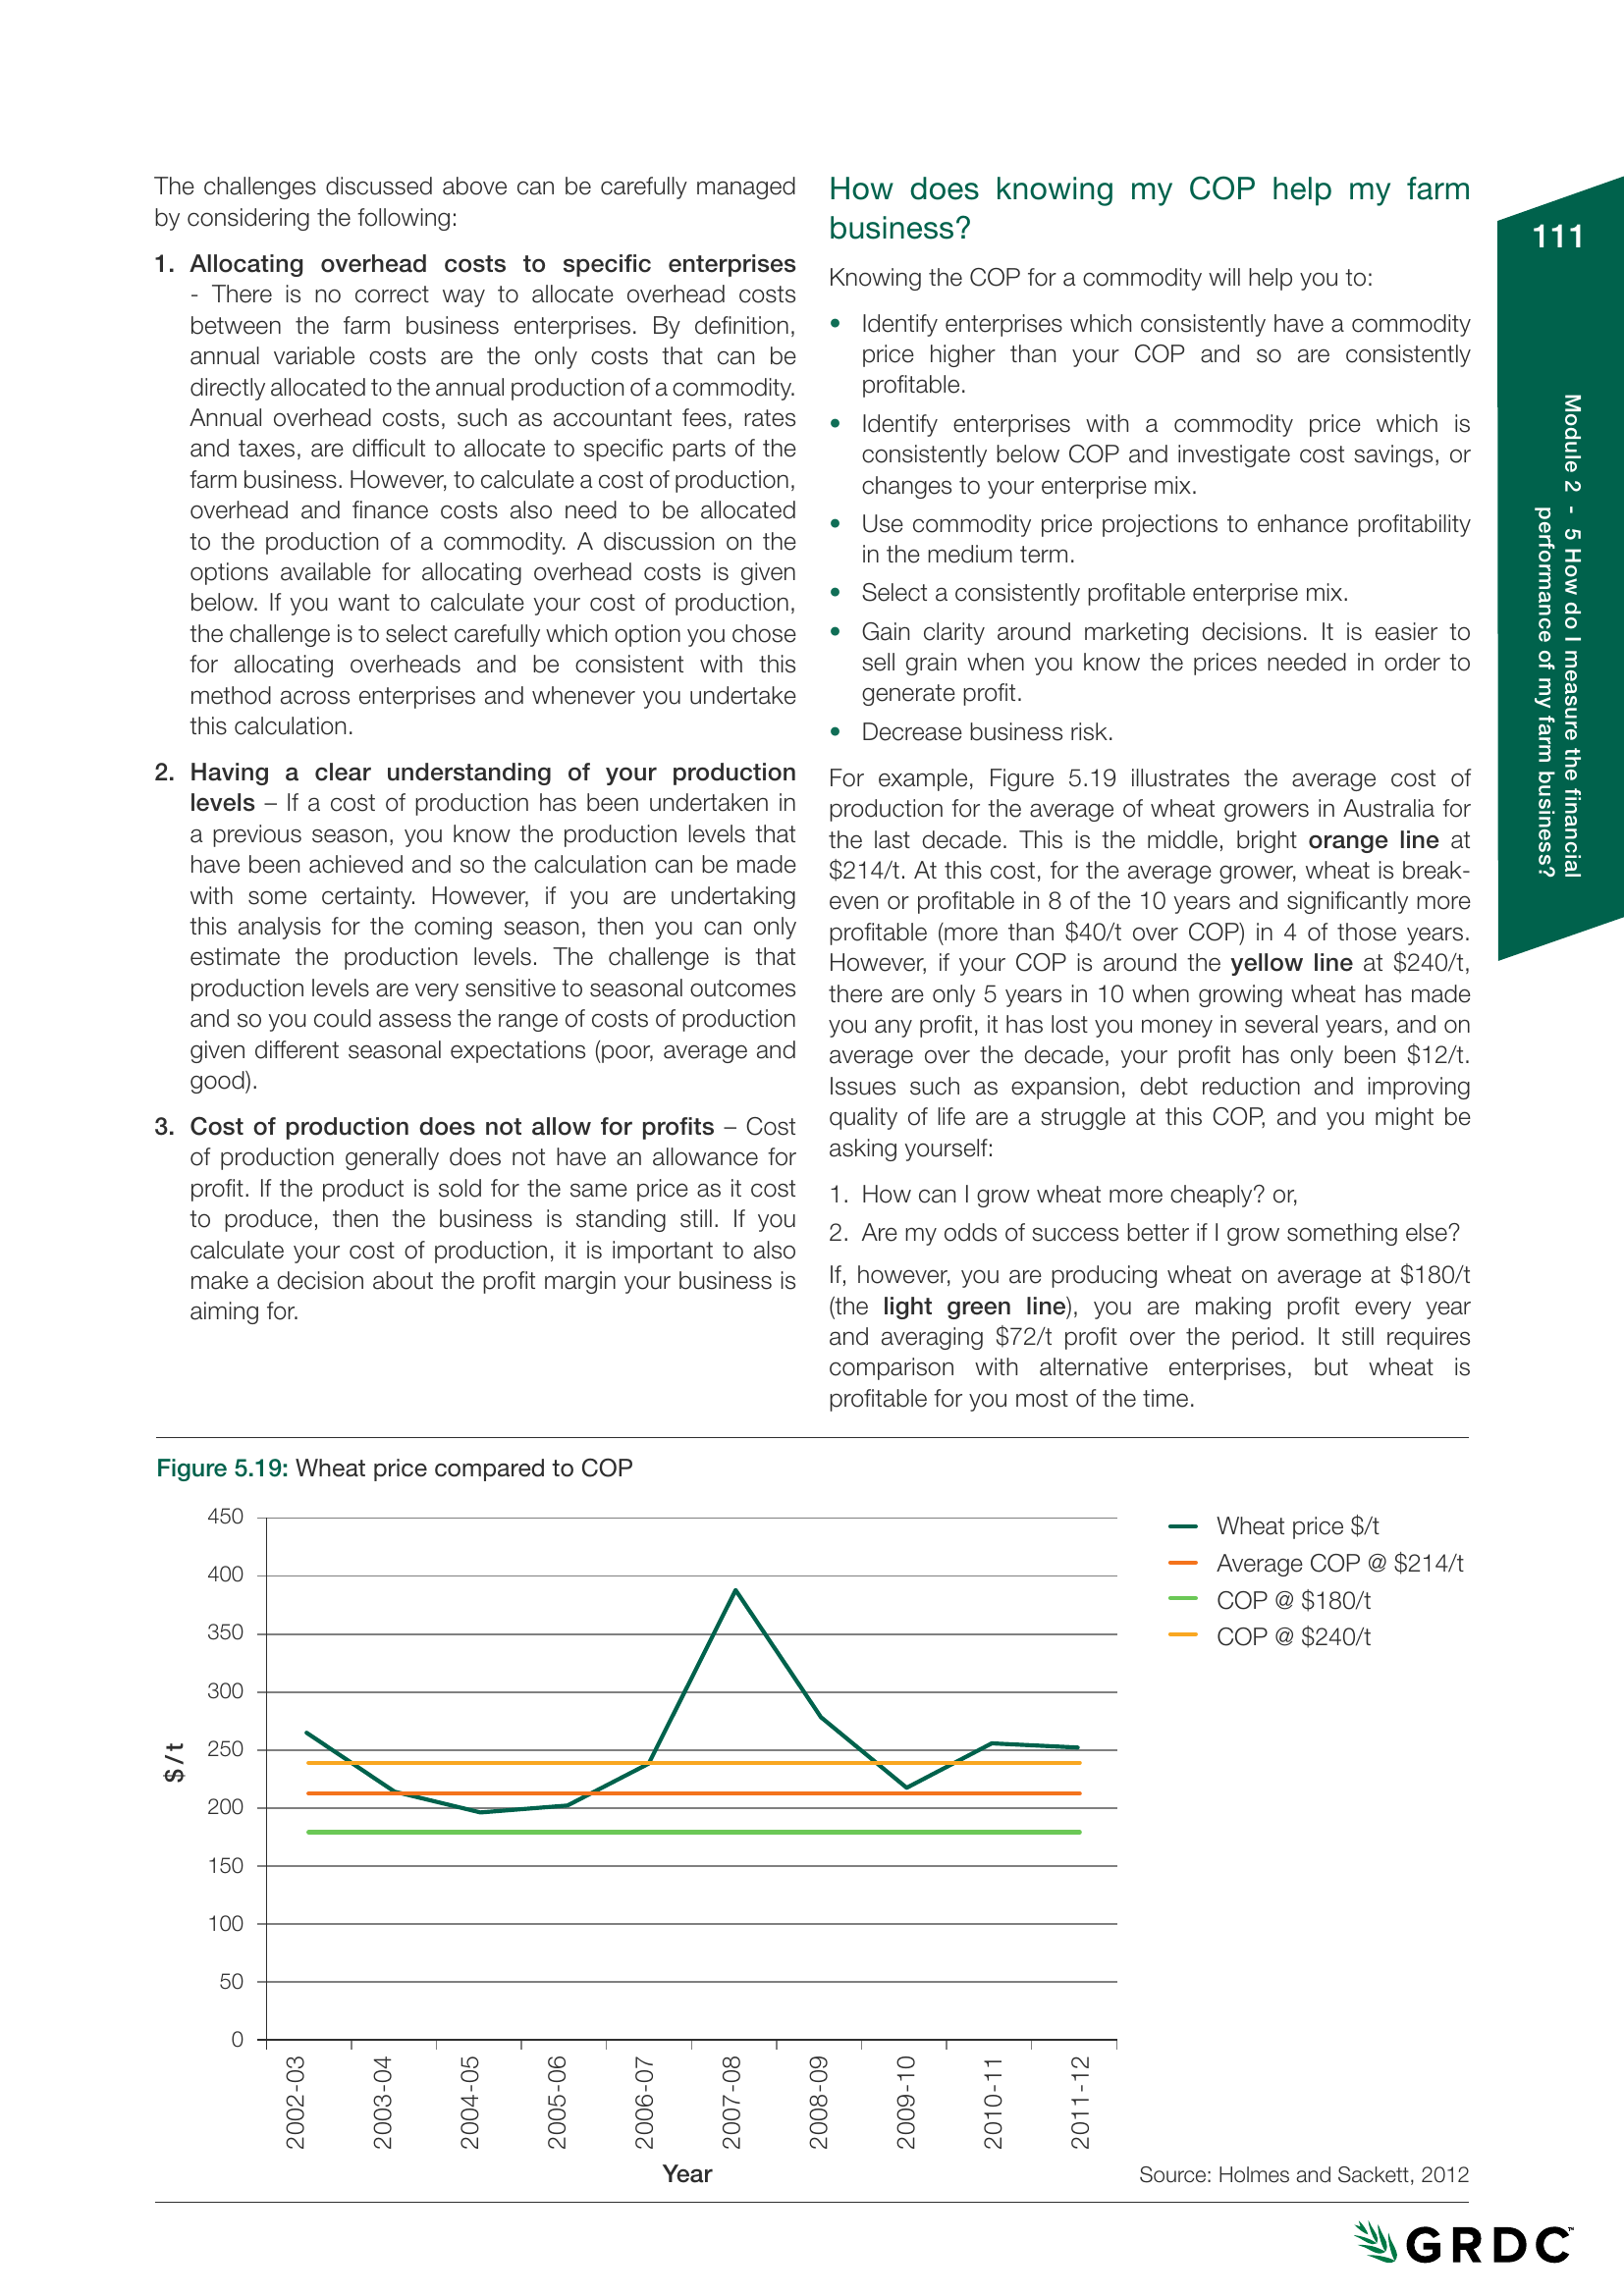
The chart below from Farming the Business shows how wheat prices compared to COP over a decade. In seasons where COP exceeded the commodity price, the enterprise made a loss. Knowing where you sit on this curve - especially when input costs are rising - is what separates reactive decision-making from proactive management.
Timing Your Input Purchases: When to Buy Forward and When to Wait
One of the most consequential decisions a farmer makes each season is when to commit to major input purchases. Buy too early and you might pay above where prices settle. Wait too long and you risk either paying more or missing out on supply entirely - as many discovered with diesel in early 2026.
There is no perfect formula for timing, but there are principles that improve your odds. For fertiliser, the general pattern in Australia is that prices tend to be lower in the off-season (October to December) and higher as demand ramps up toward sowing. Locking in at least a portion of your requirements during quieter periods reduces your exposure to price spikes. This year, however, that pattern has been disrupted by geopolitical supply constraints, making early commitment more of a gamble.
For fuel, most farmers with on-farm storage benefit from buying in bulk when prices dip rather than relying on spot purchases throughout the season. The fuel excise credit (currently 50.6 cents per litre for off-road diesel) provides a significant offset, but it does not eliminate the impact of price swings on cash flow.
The critical tool here is modelling. Rather than guessing at the right time to buy, build your season budget with different input cost assumptions and see how each scenario affects your bottom line. What does your profit look like if urea costs $1,200/t versus $1,400/t? What if diesel averages $2.00/L versus $2.50/L for the season? These are not academic questions - they directly determine whether your season is profitable or not.
Tracking Planned vs Actual: Catching Cost Blowouts Mid-Season
A budget that sits in a drawer is not a management tool. The value of budgeting comes from comparing what you planned to spend against what you actually spent - and doing it regularly enough to catch problems while you can still do something about them.
This is where many farm businesses fall down. The budget gets built at the start of the season, often for a bank presentation, and then is not looked at again until the accountant prepares the tax return. By then, it is history.
A mid-season review does not need to be complicated. The core questions are straightforward: Where are the biggest variances between planned and actual spending? Are the overruns driven by price increases (paying more per unit) or volume increases (using more than planned)? Are the variances likely to continue for the rest of the season, or were they one-off events?
For example, if you budgeted fertiliser at $1,000/t and actual cost came in at $1,400/t, that is a price variance. If you budgeted 100kg/ha of urea and applied 130kg/ha based on soil test results, that is a volume variance. The response to each is different - a price variance might mean adjusting your forward selling, while a volume variance might mean reconsidering application rates on remaining paddocks.
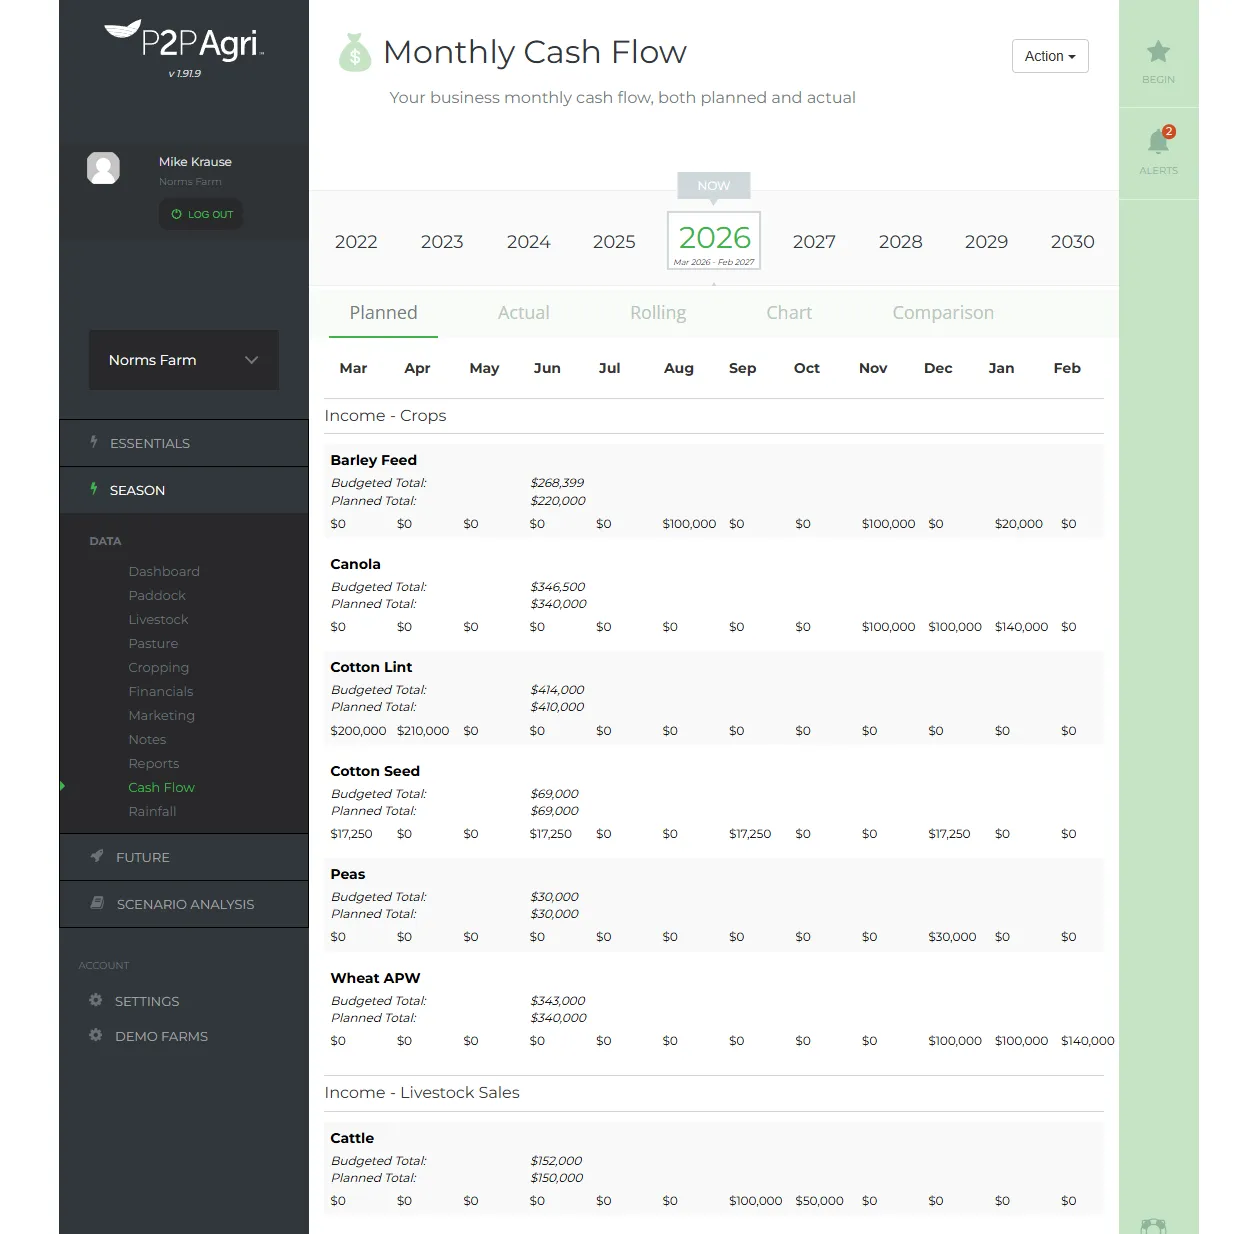
The Farming the Business manual emphasises the importance of the cash flow budget as the primary tool for managing liquidity. As it notes, monthly cash flows should capture the expenses and income for the same seasonal period, allowing you to see where you stand at any point during the year. When input costs are volatile, this kind of regular monitoring becomes even more critical.
Gross Margin Analysis: Which Enterprises Are Actually Covering Their Costs?
When input costs rise, not every enterprise on your farm is affected equally. Cropping operations are more exposed to fertiliser and chemical price increases. Livestock enterprises are more sensitive to feed costs and labour. Mixed farms have a natural diversification advantage, but only if you are tracking the gross margin of each enterprise separately.
An enterprise gross margin, as Farming the Business defines it, is the total income from an enterprise less the variable costs incurred in producing it. It shows the contribution each enterprise makes toward covering your overhead costs. The higher the gross margin, the more valuable that enterprise is to your business.
In a rising input cost environment, gross margin analysis helps you answer critical questions. Which crops are still profitable at current input prices? Should you shift hectares from a low-margin crop to a higher-margin one? Is the livestock enterprise providing a more stable return than cropping this season? Would reducing area on a marginally profitable crop and putting that land into pasture or a lower-input rotation be a better use of your resources?
These are not hypothetical questions. With urea costs effectively doubling, a canola crop that requires heavy nitrogen application might flip from profitable to marginal, while a pulse crop that fixes its own nitrogen looks relatively more attractive. The numbers tell you which way to lean - but only if you calculate them.
Three Approaches to Managing Input Costs in Practice
There is no single right way to manage rising input costs. Different farm businesses are taking different approaches depending on their financial position, risk tolerance, and enterprise mix. Here are three strategies we are seeing farmers use effectively in 2026.
Strategy 1: Reduce rates, not area. Some growers are choosing to maintain their planting area but reduce fertiliser application rates. The logic is that the first increments of nitrogen deliver the highest yield response, while the last increments deliver diminishing returns. Cutting back from, say, 120kg/ha to 80kg/ha of urea may reduce yield by 10-15% but cuts fertiliser cost by 33%. If the cost saving exceeds the revenue reduction, the farm is better off. This requires solid agronomic advice and a clear understanding of your yield response curves.
Strategy 2: Shift the enterprise mix. Other farmers are adjusting their rotation to favour lower-input crops. Pulses such as chickpeas, lentils, and faba beans fix their own nitrogen, significantly reducing fertiliser requirements for both themselves and the following cereal crop. While pulse prices and yields carry their own risks, the input cost saving can be substantial. On a mixed farm, increasing the livestock enterprise at the expense of marginally profitable cropping can also shift the cost structure in a favourable direction.
Strategy 3: Lock in costs, lock in revenue. The most methodical approach is to treat input purchasing and grain marketing as two sides of the same coin. When you commit to buying fertiliser at a known price, you simultaneously lock in a portion of your expected production through forward contracts at a price that covers that cost plus your target margin. This removes the guesswork and gives you a defined profit on the portion you have locked in, regardless of what happens to either input or commodity prices afterward.
The Sensitivity Analysis: Where to Focus Your Energy
When everything seems to be going up at once, it is easy to feel overwhelmed. The sensitivity analysis framework from Farming the Business provides a useful antidote. It ranks every cost and revenue factor by its impact on net farm profit when it changes by 5%.
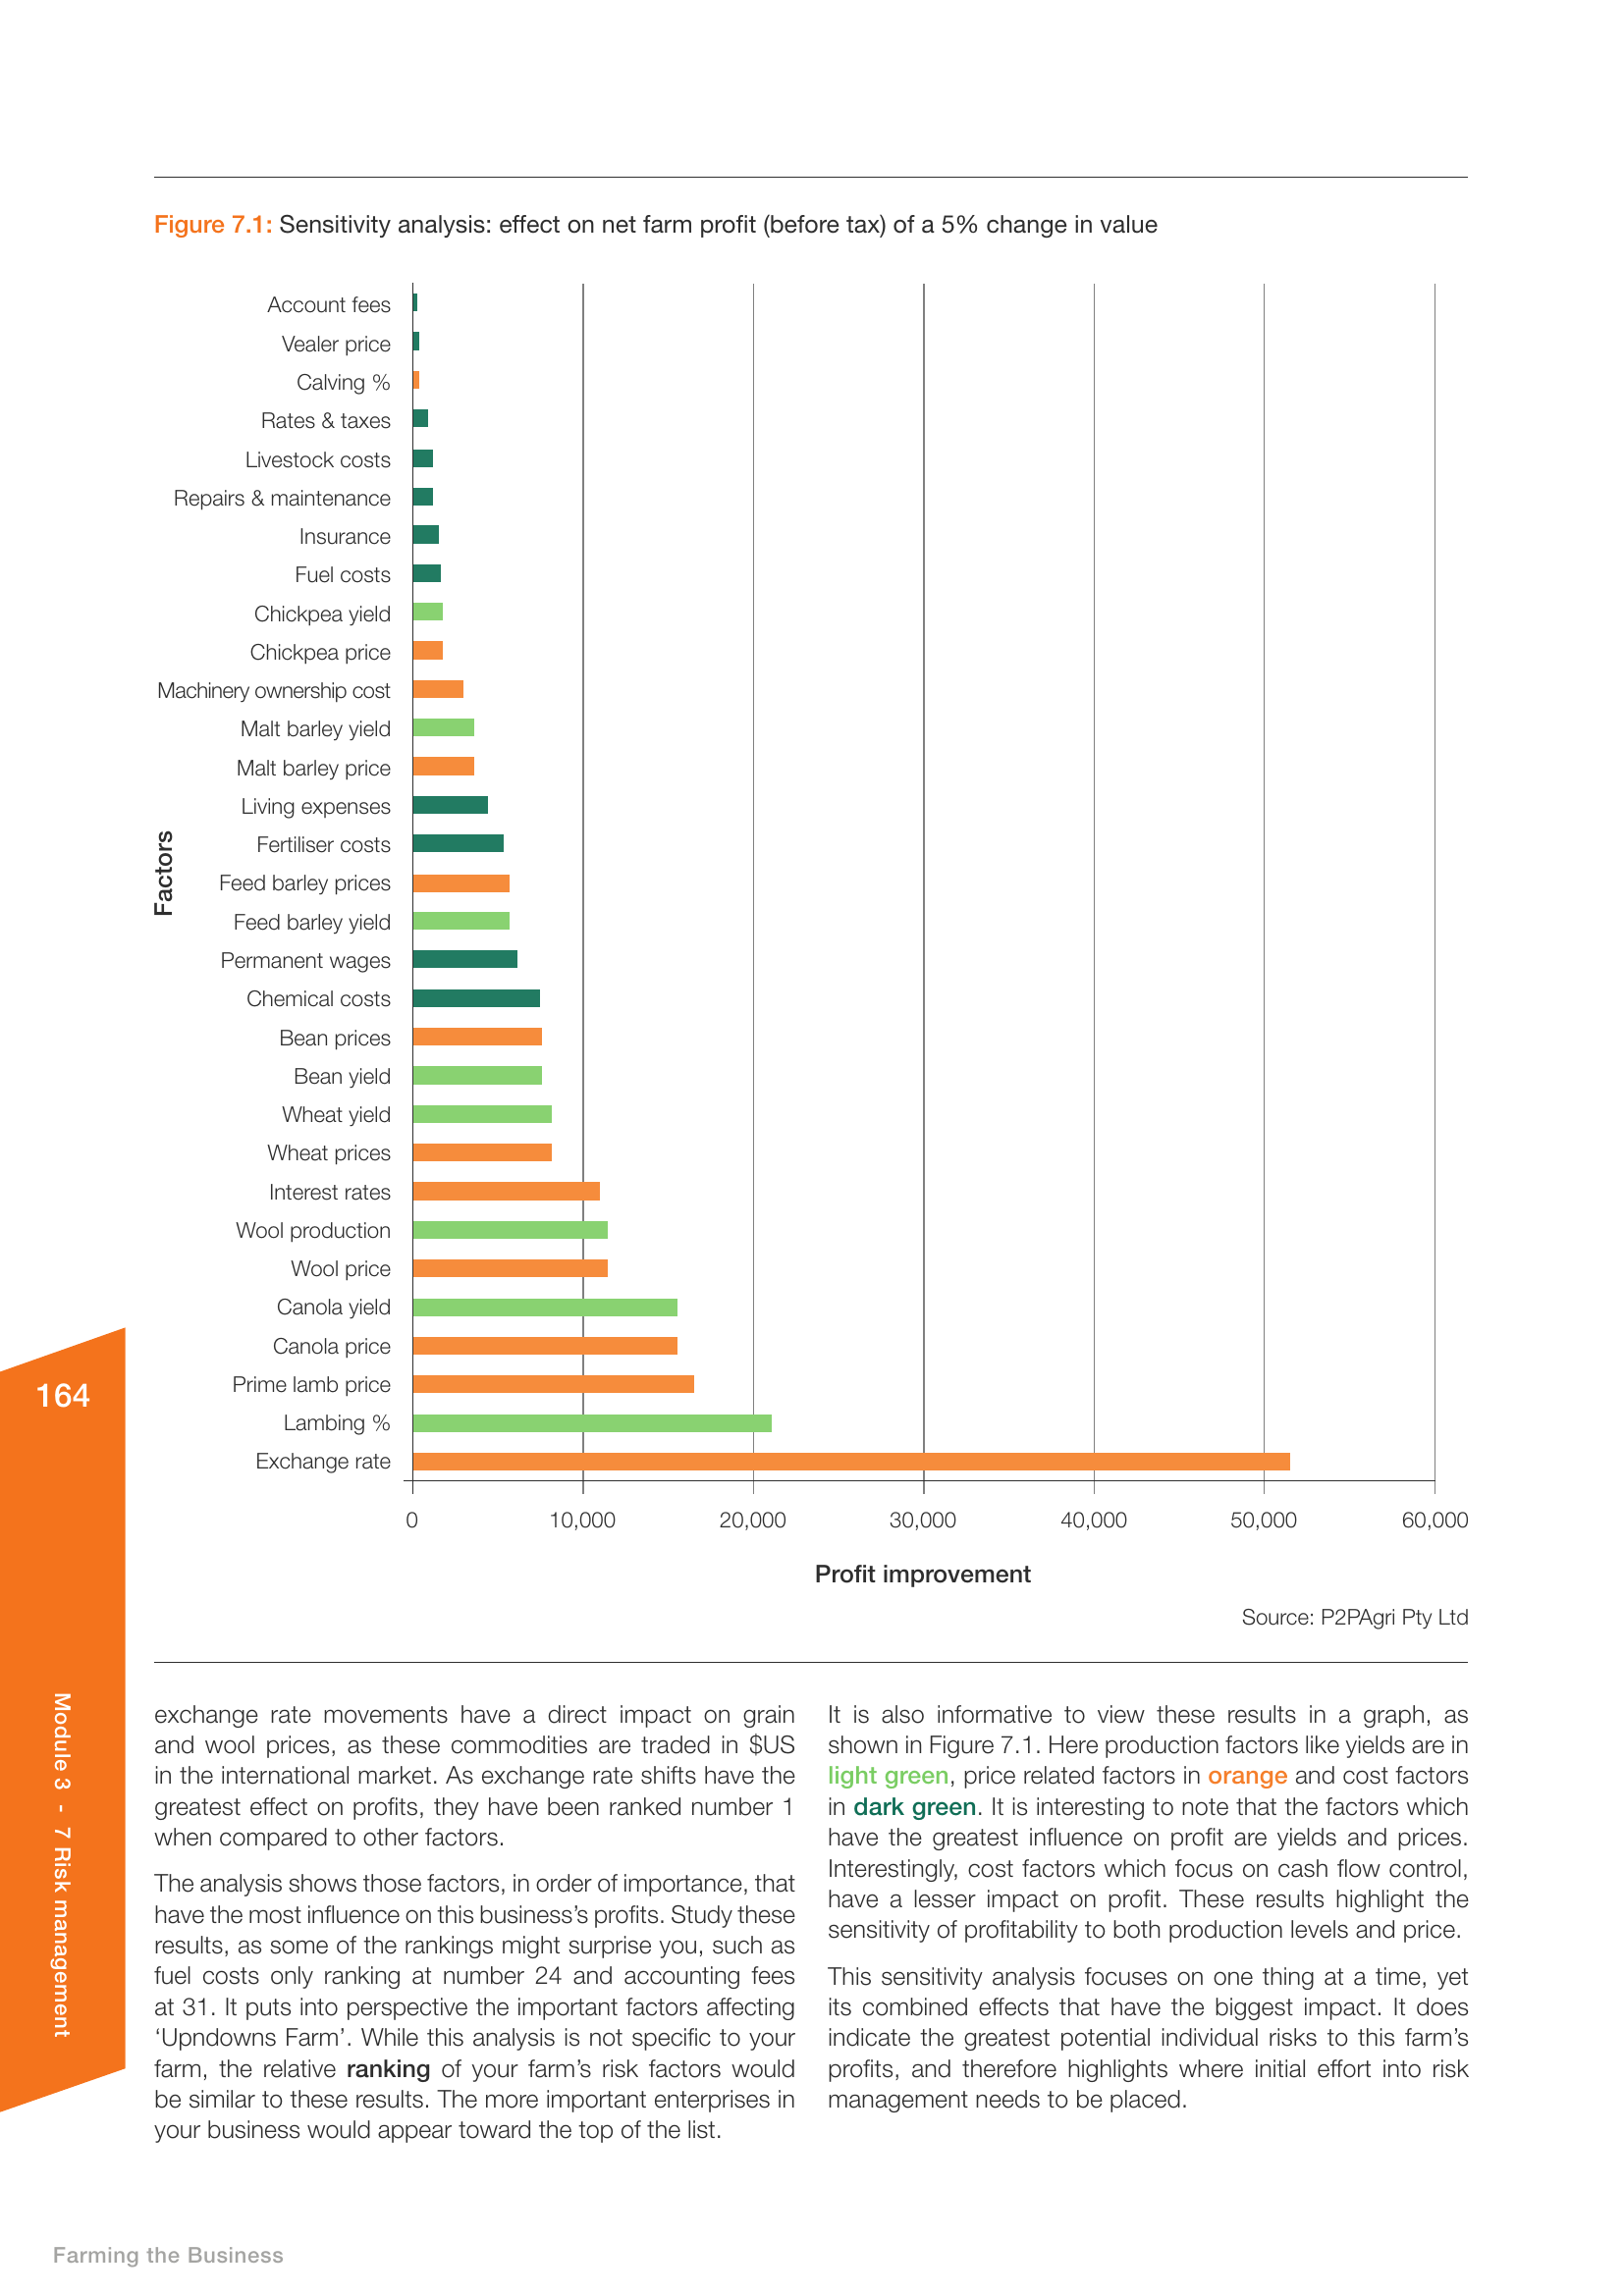
The results consistently show that yields and commodity prices have far more impact on profit than any individual cost item. This does not mean cost management is unimportant - it absolutely matters. But it does mean that a farmer who spends all their energy trying to save $5/ha on chemical costs while ignoring a $30/t marketing opportunity is focusing on the wrong lever.
The practical takeaway is to prioritise. Put your best management attention on the factors at the top of the sensitivity chart: optimising yields through good agronomy, making informed marketing decisions on timing and pricing, and managing your largest cost items (fertiliser and chemicals) well. The smaller cost items still deserve attention, but they should not consume disproportionate management time.
Build Your Season Budget and Track It
Everything discussed in this article comes together in one place: your season budget. A well-built budget with realistic input cost assumptions gives you a clear picture of expected profitability before the season starts. Regular tracking against actuals through the season tells you whether you are on track or need to adjust.
P2PAgri's farm business planning software is built for exactly this. Build your season plan with current input cost estimates, calculate your cost of production by enterprise, and track planned versus actual spending as the season progresses. When fertiliser prices move or fuel costs change, update your plan and see exactly how it affects your bottom line - in real time, not at the end of the year when it is too late to act.
Use Scenario Analysis to model different input cost assumptions side by side. What if urea stays at $1,400/t versus dropping back to $1,000/t? What if diesel averages $2.50/L for the full season? What if you reduce nitrogen rates by 25%? Having these scenarios mapped out before the pressure points hit means you can make decisions quickly and confidently when conditions change.
Download the free Farming the Business manual for the complete framework on cost of production, gross margin analysis, and risk management. And start your free P2PAgri trial to put these principles to work with tools that sync with your Xero data and give you a live view of where your farm business stands - this season and into the future.
Put This Into Practice
P2PAgri helps you apply these concepts with interactive tools and real-time analysis of your farm data.
Get Started Free