
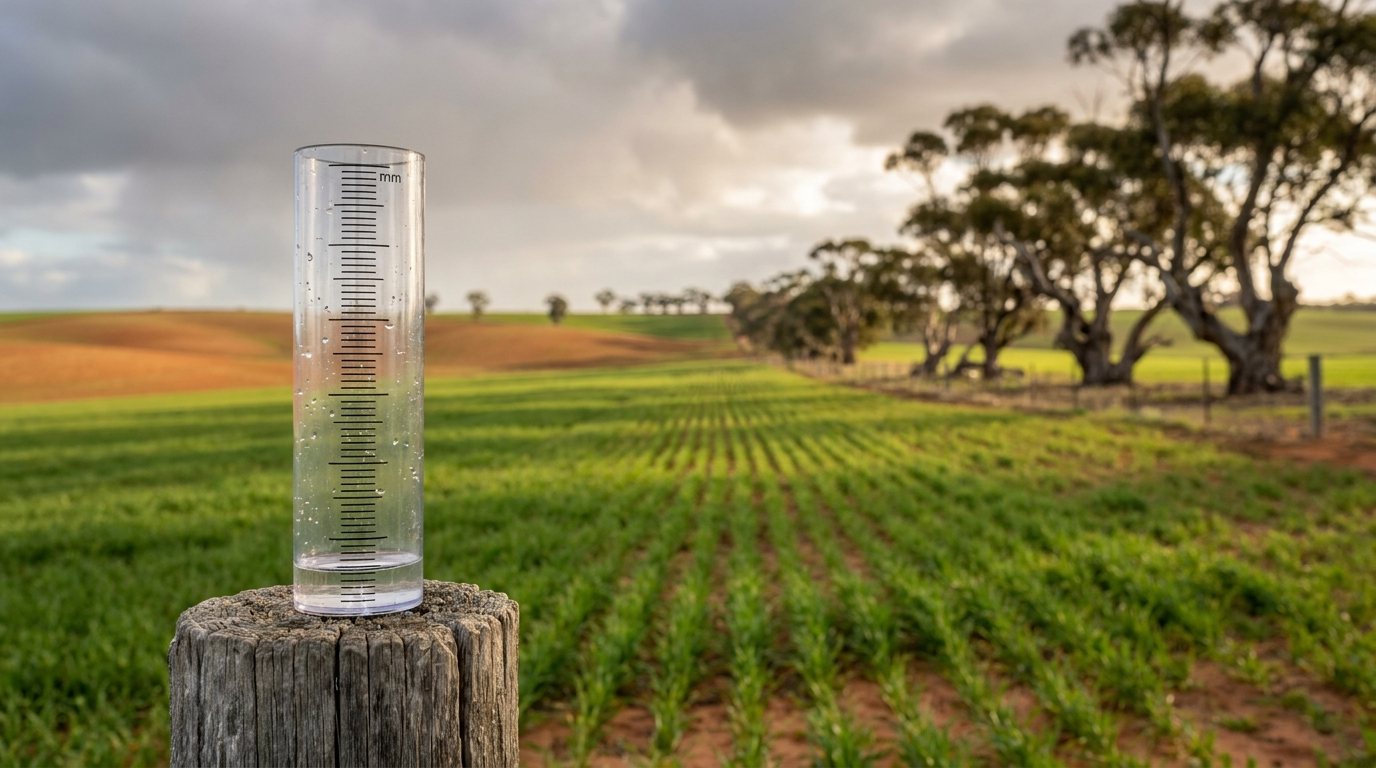
Rainfall deciles are how the Bureau of Meteorology says whether a season is dry, average or wet, and they are far more use to a farm budget than “above or below average”. Here are rainfall deciles explained in plain terms: what the number means, how to read your rainfall to date against every year since 1900, and how to turn three possible finishes to the season into three budgets.
Many explanations stop at the definition. The part that matters is the money. On the illustrative farm below, the gap between a decile 1 finish and a decile 9 finish is $720,000 of gross margin on the same 1,500 hectares. In July, the rain that decides where the year lands in that range has not fallen yet. A decile read then is early enough to change your nitrogen, forward sales, feed and stock numbers. Wait for harvest and the season has made those calls for you.
Quick Answer
A rainfall decile ranks a period’s rainfall against the same period in every year on record at that place. The years are sorted from driest to wettest and split into ten equal groups: decile 1 is the driest tenth, decile 5 the middle and decile 10 the wettest tenth. A decile 5 season means roughly half the years on record were drier and half were wetter.
- Rank rainfall to date against the same dates in earlier years, never against whole years.
- Budget three finishes: decile 1, median (decile 5) and decile 9. They are a range, not a forecast.
- Make the dry budget survivable before you commit nitrogen, forward sales, feed or stock numbers.
What a rainfall decile is, and why it beats “above or below average”
Take every year on record at your location, rank the rainfall for the same period from lowest to highest, and cut the list into ten equal groups. That is how the Bureau of Meteorology builds its decile maps. Your season’s decile is the group it lands in: decile 6 means between five and six years in ten were drier. In the Bureau’s own definitions, rainfall stayed at or below the decile 1 amount in 10 per cent of years, and went above the decile 9 amount in 10 per cent. The median, or decile 5, is the middle year.
“Below average” sounds bad, but on its own it tells you very little. Rainfall is lopsided. A few very wet years pull the mean up, which is why the Bureau calls the median “usually the preferred measure of ‘typical’ rainfall”. Where a handful of big years have lifted the average, more than half of all years finish below it, so a below-average season can be a perfectly ordinary one. That is why the plan in this article is built on the median, not the average.
| Decile band | Bureau wording | What it means | What to model |
|---|---|---|---|
| Lowest on record | Lowest on record | Drier than any earlier year on record | Your worst case, and the drought triggers you have written down |
| 1 | Very much below average | Among the driest tenth of years | The decile 1 budget, which sets nitrogen, forward sales, feed and stock numbers |
| 2 to 3 | Below average | Drier than most years, but not the driest tenth | The poor year some advisers budget on instead of decile 1 |
| 4 to 7 | Average | The middle 40 per cent of years | The median (decile 5) budget: your plan |
| 8 to 9 | Above average | Wetter than most years, but not the wettest tenth | The upside, and the nitrogen, harvest capacity and storage it needs |
| 10 | Very much above average | Among the wettest tenth of years | The decile 9 budget, plus waterlogging, disease and harvest risk |
| Highest on record | Highest on record | Wetter than any earlier year on record | Access, harvest timing, storage and freight |
Decile bands and wording as used on the Bureau of Meteorology’s rainfall decile maps. The last column is a planning suggestion, not Bureau advice.
Rainfall to date: reading your season against every year since 1900
Part way through a season, the useful question is how the rain so far compares with the same dates in every earlier year. On 31 July, rainfall from 1 April to 31 July is ranked against 1 April to 31 July of every year on record. Rank a part-season total against whole-season totals and almost every season looks like a drought until the last month.
Pick the window that matches the decision. For crops, that is the growing season, typically April to October in southern Australia, as in our water use efficiency article.
A wet June does not make a wet season: a season’s decile comes from the season’s own totals, not from adding up monthly deciles. And ignore the decile of a month that is nearly always dry at your place, where one shower can move it from decile 1 to decile 9.
Why your gauge and the map can disagree
A gauge measures one spot. Gridded records such as the Queensland Government’s SILO are built from Bureau observations interpolated across a grid of about 5 km by 5 km. A storm that hits or misses your gauge shows in full on the gauge and smoothed on the grid, so in a patchy season the two can sit a decile apart. Neither is wrong: the grid gives a long record to rank against, and the gauge tells you what fell at your place.
Decile finishes and what they mean for yield
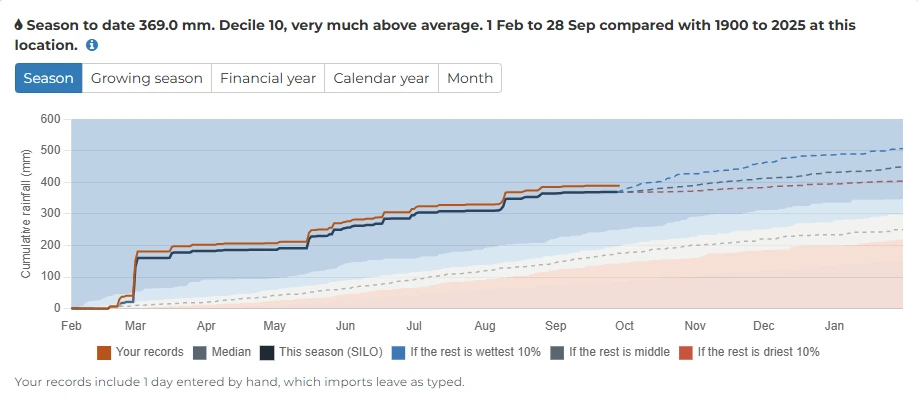
A decile finish is the rain you already have, plus what the rest of the season would add if it ran like a particular group of past years. A decile 1 finish assumes the rest of the season comes in among the driest tenth of years, a median finish that it follows the middle, and a decile 9 finish that it comes in among the wettest tenth. DPIRD’s Rainfall to Date tool draws them as dashed lines from today and calls them historical finishes to a season. P2PAgri’s Rainfall page draws the same three for your farm.
A finish is not a forecast. It shows the range history allows from where the season is now, and that range narrows as the season runs out. For a view on which way it might go, read the Bureau’s long-range forecast alongside it.
To turn a finish into tonnes, many growers use French and Schultz. The GRDC’s water use efficiency fact sheet puts water-limited wheat yield at 20 kg a hectare for every millimetre of water supply above 110 mm, the allowance for evaporation. April to October rainfall is often used as the water supply, which the GRDC warns can mislead because it leaves out stored soil water.
French and Schultz, wheat
Water-limited yield (kg/ha) = 20 × (growing season rainfall in mm, minus 110 mm)
A 235 mm season gives 20 × 125 = 2,500 kg/ha. Later research, summarised in a 2026 GRDC Update paper, has revised both numbers, but the logic holds: the finish sets the ceiling.
The better guide is your own history: line up each season’s yields against the decile it finished in. P2PAgri’s published case study on expanding the farm or investing off-farm used that kind of table for a 2,000 hectare mixed farm in South Australia’s Lower North: wheat at 3.2 t/ha in a decile 3 season, 5.0 in decile 5 and 6.0 in decile 7, and canola at 1.2, 1.8 and 2.2 t/ha.
Notice the shape. From decile 5, the dry side costs that wheat 36 per cent of its yield and the wet side adds 20 per cent; canola loses a third and gains 22 per cent. If your records look the same, the dry budget deserves the most attention.
Turning three finishes into three budgets
Here is the method on an illustrative farm with round numbers. It is not a real farm, and the rainfall figures are made up for the example.
It is 31 July. The farm has 1,500 hectares of wheat and 145 mm of growing season rainfall since 1 April.
- Rain still to come. In the farm’s record, August to October adds about 40 mm in the driest tenth of years, 90 mm in a median year and 140 mm in the wettest tenth.
- Efficiency. The farm usually reaches 80 per cent of the French and Schultz potential, worked out from its own yields and growing season rainfall. P2PAgri’s water use efficiency calculator shows this figure once the yields are entered.
- Price and costs. Wheat is budgeted at $300 a tonne net at the farm gate, $250 a hectare of variable costs is already spent, and overhead and finance costs are $400,000.
Illustrative farm: 1,500 ha of wheat, three finishes from 31 July
| Budget line | Decile 1 finish | Median finish | Decile 9 finish |
|---|---|---|---|
| Rain still to come, August to October | 40 mm | 90 mm | 140 mm |
| Growing season rainfall | 185 mm | 235 mm | 285 mm |
| Water-limited yield, 20 × (rain minus 110 mm) | 1.5 t/ha | 2.5 t/ha | 3.5 t/ha |
| Budget yield at 80% of that | 1.2 t/ha | 2.0 t/ha | 2.8 t/ha |
| Tonnes from 1,500 ha | 1,800 t | 3,000 t | 4,200 t |
| Income at $300/t | $540,000 | $900,000 | $1,260,000 |
| Variable costs already spent, $250/ha | $375,000 | $375,000 | $375,000 |
| Gross margin | $165,000 | $525,000 | $885,000 |
| Overhead and finance costs | $400,000 | $400,000 | $400,000 |
| Result for the year | -$235,000 | $125,000 | $485,000 |
Illustrative only, excluding GST. Price and costs are held the same in every column, which flatters the decile 9 column: a bigger crop costs more to harvest, cart and feed with nitrogen.
Three things stand out.
- The range is $720,000 of gross margin from the same paddocks and costs, on rain that has not fallen yet.
- The median budget, the plan, makes $125,000. The decile 1 budget loses $235,000, and that lands on the overdraft. If the facility does not have that much room at its low point, you want to know in July, not after harvest.
- Break-even sits in between. Costs of $775,000 ($375,000 spent plus $400,000 of overheads and finance) at $300 a tonne need about 2,583 tonnes, or 1.72 t/ha. At 80 per cent of potential that takes about 218 mm of growing season rainfall, about 73 mm more by the end of October. The question becomes: how often has August to October given us 73 mm or more?
Then run each budget through the monthly cash flow. Profit tells you whether the year works; the cash flow tells you which month the money runs short, which for many winter croppers falls between the autumn input bill and harvest. Our guide to building a farm cash flow forecast walks through it, and our El Niño planning guide runs the same kind of scenarios.
Some advisers budget the poor year on decile 2 or 3 instead. That is a fair choice if you know the risk: the season finishes worse than a decile 3 budget about three years in ten, and worse than a decile 1 budget about one year in ten.
How to use rainfall deciles for farm decisions
A decile read is worth checking only if it can change a decision. These are the four it should change, while the cheap options are still open.
Nitrogen
Spring rain decides whether in-crop nitrogen pays. SARDI’s Peter Hayman put it plainly in a 2022 GRDC Update paper: “The main factor determining efficiency of N recovery is the moisture available to the crop in spring.” He frames the choice as which decile to aim for. Aim for a decile 7 finish and you over-fertilise six years in ten; aim for decile 3 and you under-fertilise seven years in ten. He also warns against N budgeting “with a single target yield in dryland farming where spring rainfall is unpredictable”.
The trial evidence leans cautious. In CSIRO and NSW DPI farming systems trials reported to the GRDC in 2021, nitrogen was top-dressed for either a decile 2 or a decile 7 finish. In 2018 and 2019, both decile 1 seasons, grain yield did not respond to the higher N strategy. Even in the wetter 2020 season, for timely-sown crops, “in most cases the extra cost of N was not reflected in higher profit”. Across the three years, the decile 2 strategy generally gave “a much higher return on N investment”. Early-sown crops that were grazed were the exception: grazed systems “responded profitably to higher N”.
Price the top-up against the gap between your decile 1 and median budgets, not against the decile 9 column, and settle the rate with your agronomist.
Forward selling
Our grain marketing plan guide sizes forward sales against the tonnes you would still harvest in a poor season. The decile 1 budget gives you that number: 1,800 tonnes on the illustrative farm, not the 3,000 in the plan. Re-read it every few weeks. Rain lifts all three finishes, time pulls them together, and the decile 1 line shows the tonnes you would still harvest in all but about one year in ten. Treat it as a ceiling on what you commit now, not a guarantee.
Feed
For livestock, the decile 1 finish is a feed budget: how much pasture and stubble the stock would have if the rest of the season came in among the driest tenth of years, and how much hay or grain would fill the gap. Price that feed while it is still a choice, not once every neighbour is buying too.
Stocking rate
Stock numbers are the slowest decision to reverse, so set the trigger in advance: for example, if the season to date is still decile 2 or lower on 1 September, a set share of the trading stock goes. Graziers may prefer the financial year or their own season to April to October. Our drought planning page shows how to model destocking in a drought scenario and find the yield at which your cash flow goes negative.
Where to get your farm’s rainfall deciles
The Bureau of Meteorology
The Bureau’s rainfall maps show deciles across Australia for periods of 1 to 12 months and 18, 24, 36 and 48 months, plus month to date and year to date. They give the district picture, not your farm. For a single weather station, the Bureau’s Climate Data Online statistics include decile 1, median and decile 9 rainfall.
DPIRD Rainfall to Date (Western Australia)
DPIRD’s Rainfall to Date tool graphs growing season rainfall at weather stations across Western Australia against deciles 1, 5 and 9, with dashed historical finishes from today. At the time of writing (October 2026), it works the deciles out from 1975 to last year, borrows history from the closest SILO station where a station’s own record is short, and lets you set the season dates.
Your own gauge
Your gauge is the best record of what fell at your place, but on its own it rarely has enough years to rank. The Bureau cautions that fewer than 30 years of rainfall data may not produce reliable statistics. Rank a long record for your location and draw your gauge beside it.
P2PAgri’s Rainfall page
P2PAgri’s Rainfall page does that for your farm, and all it needs is the farm boundary drawn on the map, or its location set. There is nothing else to enter. It ranks the SILO gridded rainfall for your farm’s location, a cell of about 5 km, against every complete year from 1900 to last year, in the Bureau’s decile wording. The season to date is only compared with the same dates in earlier years, and your own entered or imported rainfall is drawn over the top for comparison.
Three dashed lines from today show the decile 1, median and decile 9 finishes. As with DPIRD’s, they are not a forecast. You can switch between your season, the growing season (1 April to 31 October), the financial year, the calendar year and a single month, and each month’s bar is tinted by its own decile. The printed report pack can include a Rainfall section. It is part of rainfall tracking on the paid Season plan.
From three finishes to a cash flow in P2PAgri
The Rainfall page tells you where the season sits. The money questions live in the budget and the cash flow, and which P2PAgri plan you need depends on how far you want to take them:
- Season plan: the Rainfall page, plus monthly cash flow planning: put a dry finish into the budget and it shows which month the money runs short.
- Future plan: everything in Season, plus scenario analysis. Copy your farm plan into decile 1 and decile 9 scenarios, change yields and costs in each, and compare them side by side.
- Essentials, the free plan: your P&L, balance sheet and bank ratios. It does not include rainfall.
The pricing page shows which plan includes what.
About the numbers here
The worked example is an illustrative farm with made-up rainfall and round numbers. The decile 3, 5 and 7 yields come from P2PAgri’s published case study and show a method, not a benchmark for your district. Decile finishes are not forecasts. This is general information, not financial or agronomic advice.
The short version
A rainfall decile tells you where this season sits among every year on record: decile 1 the driest tenth, decile 5 the middle, decile 10 the wettest tenth. Rank your rainfall to date against the same dates in earlier years, budget three finishes (decile 1, median and decile 9) and put each through the cash flow. Set nitrogen, forward sales, feed and stock numbers so the decile 1 budget survives, and let the season earn the rest.
Keep reading
Grain Marketing Plan: When to Sell, Store or Forward Sell in Australia
A grain marketing plan for Australian farms: when to sell, store or forward sell, a target price formula, the cost of storing grain and a one-page template.
Planning Your Farm for El Niño 2026: 4 Financial Scenarios
Planning your farm for El Niño in 2026: four financial scenarios to run now, based on how the 2018-19 event cut Australian farm cash income by 41%.
Managing Farm Input Costs When Everything Keeps Rising: A Practical Guide
Managing farm input costs as urea and diesel keep rising: where your money goes, how to calculate your break-even, and three ways farmers protect margins.